
New Feature Drop: Kill Switch, P&L Calendar & 52-Week High/Low
SAHI
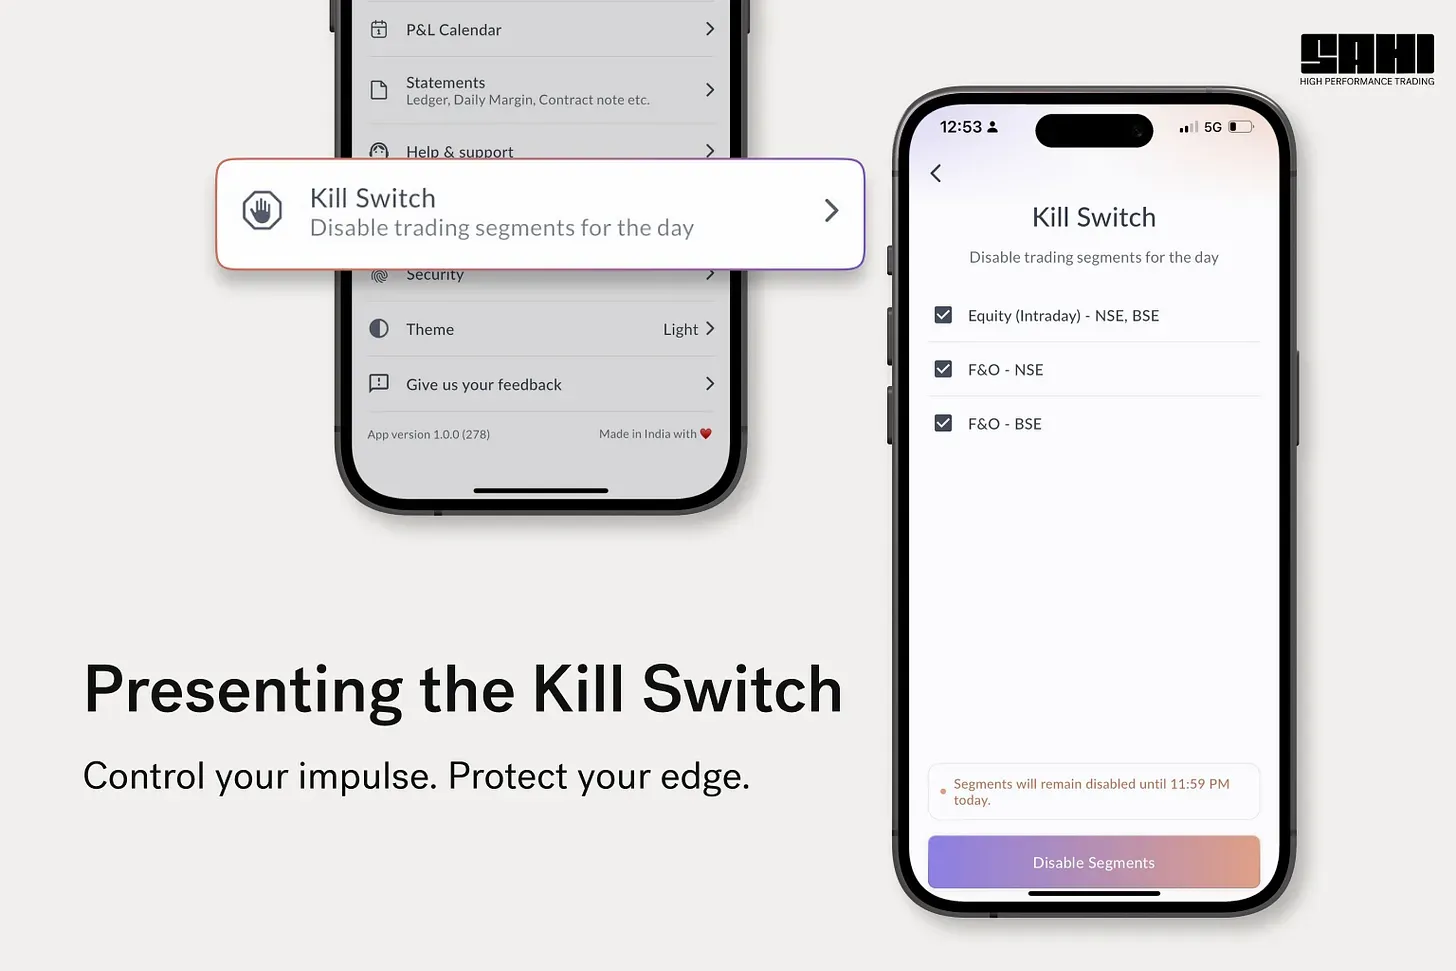
Kill Switch—Take Control of your Trading
Every trader has been there in a situation where they know that their emotions is against them. This often leads to overtrading. Furthermore, it is one of the most common reasons traders blow up accounts. Not due to bad analysis, not bad luck, but bad discipline in a bad moment.
That's exactly what the Kill Switch on Sahi is built to prevent.
What is the Kill Switch?
The Kill Switch is a one-tap feature that lets you disable any trading segment, Equity (Intraday), or F&O for the rest of the trading day. Once enabled, those segments are locked until the market day resets. No second-guessing. No temptation. You're in control.
You'll find it inside the Sahi app under Profile → Kill Switch.
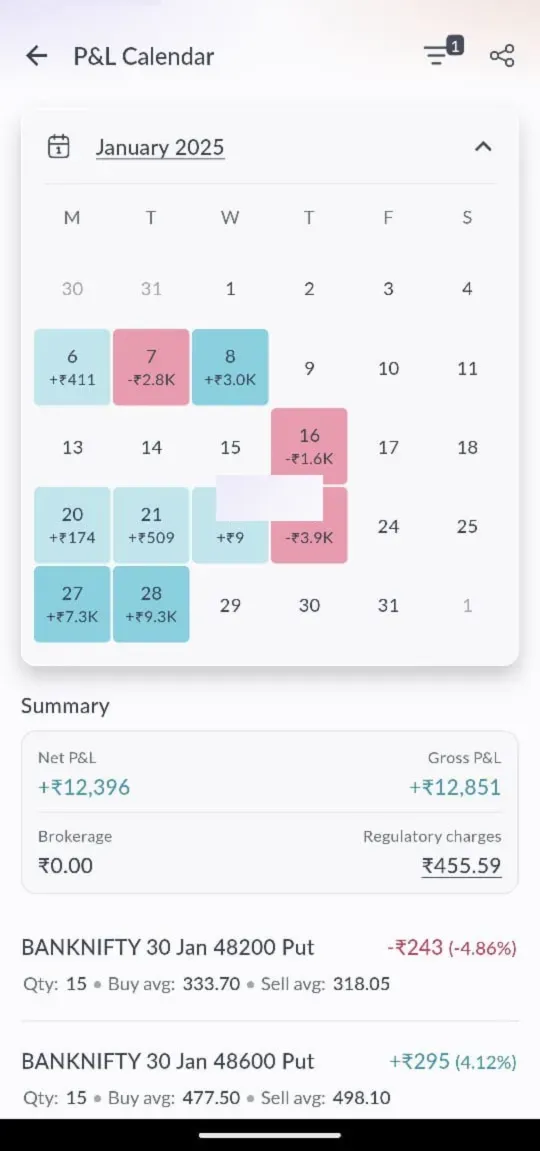
P&L Calendar
Journaling trades is one of the most recommended habits in trading. Most traders know this. Almost none do it consistently, because it's tedious and time-consuming.
The P&L Calendar on Sahi makes it automatic.
What is the P&L Calendar?
The P&L Calendar gives you a clean, day-by-day visual of your F&O profits and losses for the month. Each trading day is color-coded — green for profitable days, red for losses — so you can see your performance pattern at a single glance. No spreadsheets. No manual entry.
Tap any day and you get a full breakdown:
- Gross P&L vs Net P&L
- Brokerage charged
- Regulatory charges — STT, exchange fees, GST, SEBI charges
- Individual trade details with instrument, quantity, and buy/sell averages
See a day-by-day snapshot of your profits and losses with the new F&O and Equity P&L calendar. Instantly spot green vs. red days, along with a detailed breakdown of all charges for every trade. You can even share your monthly P&L calendar with friends!
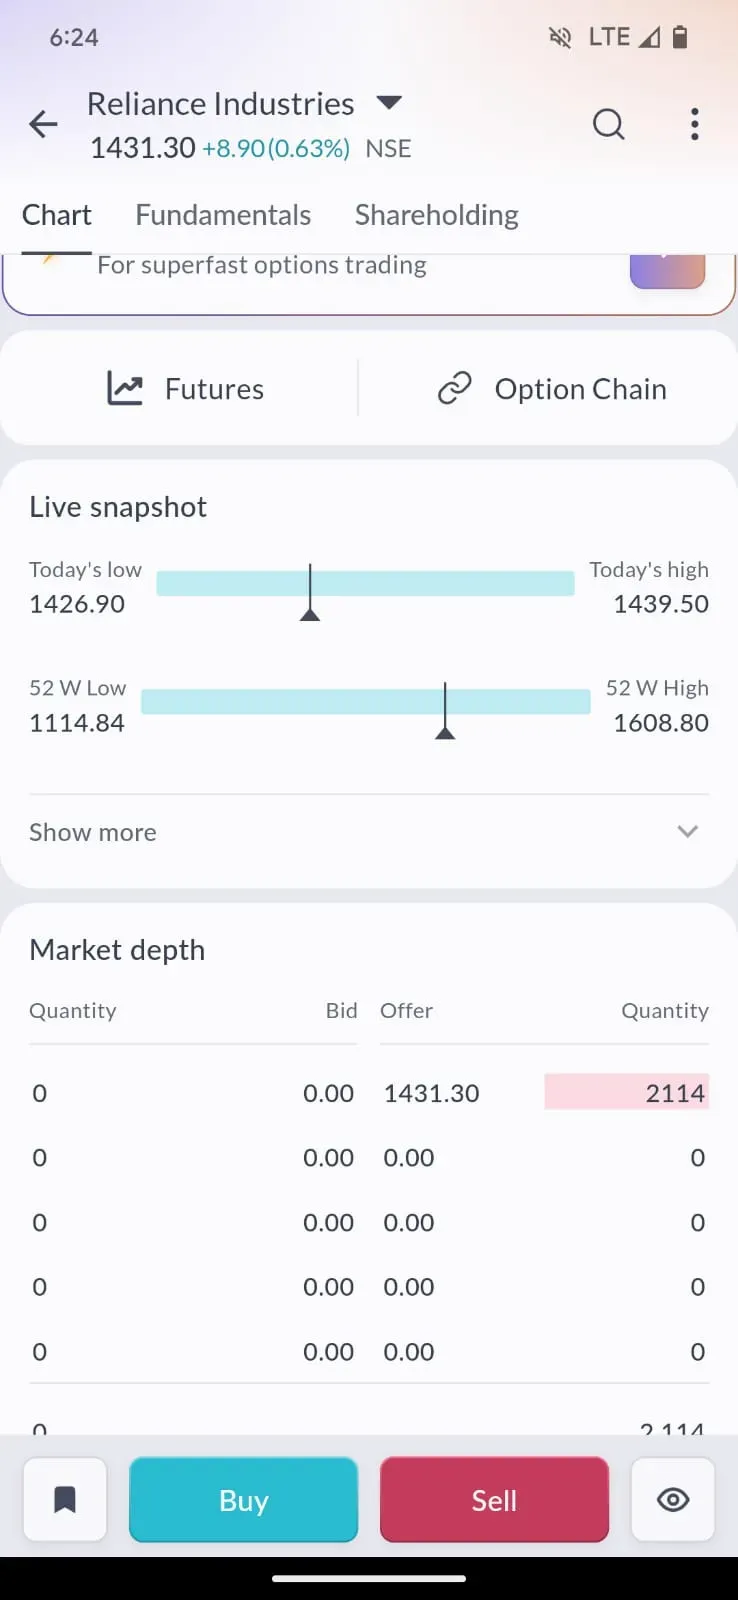
52-Week High/Low for Stocks
A stock price without context tells you almost nothing. ₹1,400 could mean a stock at its peak or one quietly recovering from a 60% correction — you wouldn't know from the number alone. The 52-Week High/Low feature on Sahi changes that.
What is it?
Now visible directly on the stock screen, Sahi shows you the 52-week high and low as a live snapshot bar, so you can immediately see where the current price sits relative to its full annual range. Today's high/low and the 52W high/low are all displayed in one clean visual, without any extra taps or navigation.
Why this matters for you
The 52-week range is one of the most closely watched data points by traders and fund managers alike. Here's why it matters in your decision-making:
- Stock near its 52W high? It could be breaking out — or running into resistance
- Stock near its 52W low? It might be an opportunity — or a falling knife worth avoiding
- Today's move in context: A 1.5% drop looks very different when the stock is at its 52W high versus already down 40% from it
Before this feature, you'd need to check the chart or look this up separately. Now it's right there, in context, exactly when you need it.
Related
Recent
SEBI’s AI Tool ‘Sudarshan’: The End of “Expiry Income” Content?
Iran–Israel Conflict: The Middle East Risk Your Portfolio Isn’t Pricing In
Zomato Share Price Falls for 8 Straight Days. What's Really Going On?
Why Holi Flight Prices in 2026 Are Up 185% — And What's Really Behind the Surge
MCX Gold: Meaning, Contract Details, Trading Rules and Outlook in India