Charts and execution, finally on one screen
Built for traders who act on what they see
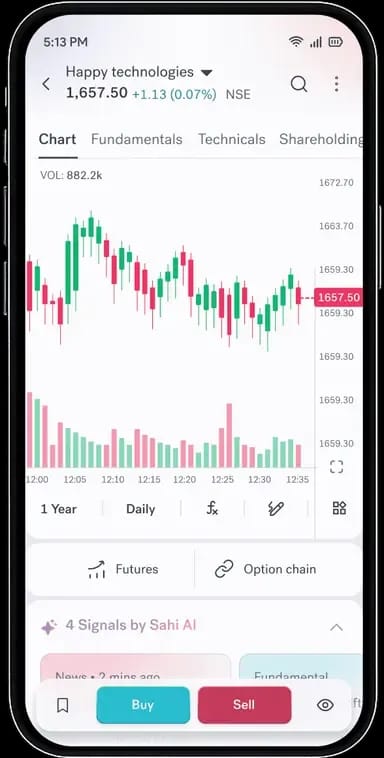
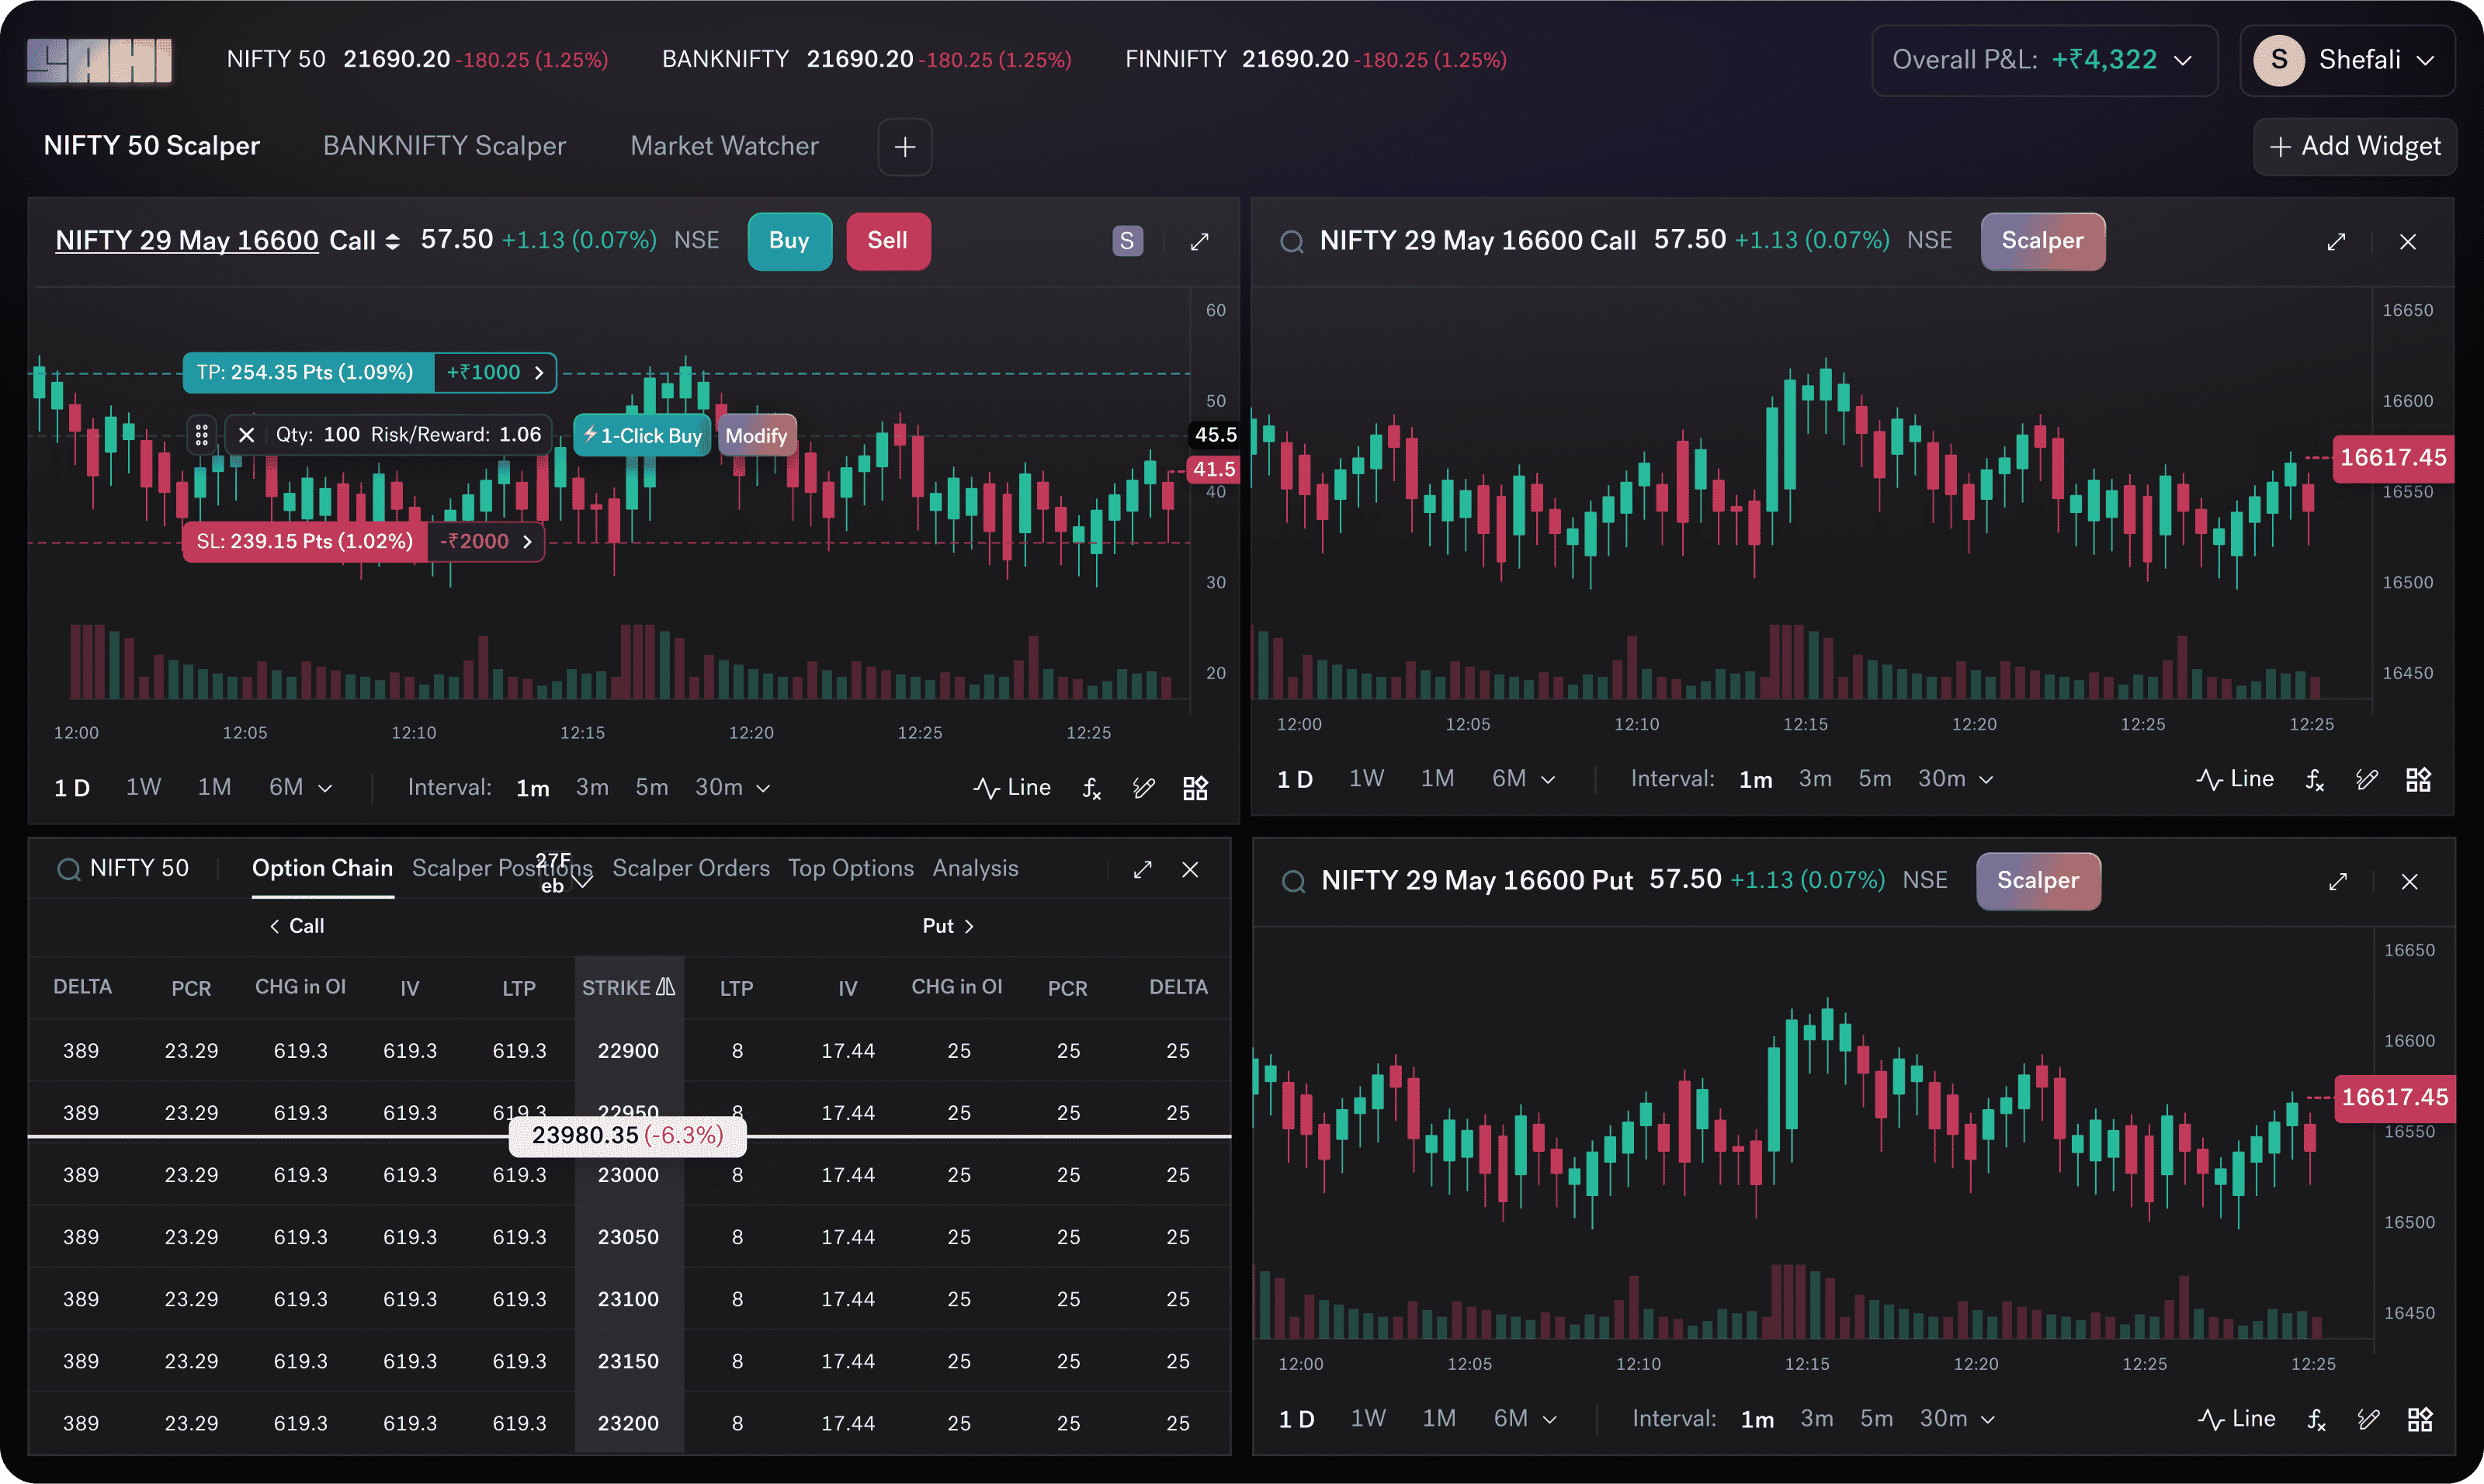
Trade from the chart
Place orders and drag Stop-Loss, Take-Profit, and Trailing SL levels visually, right where your analysis says they belong.
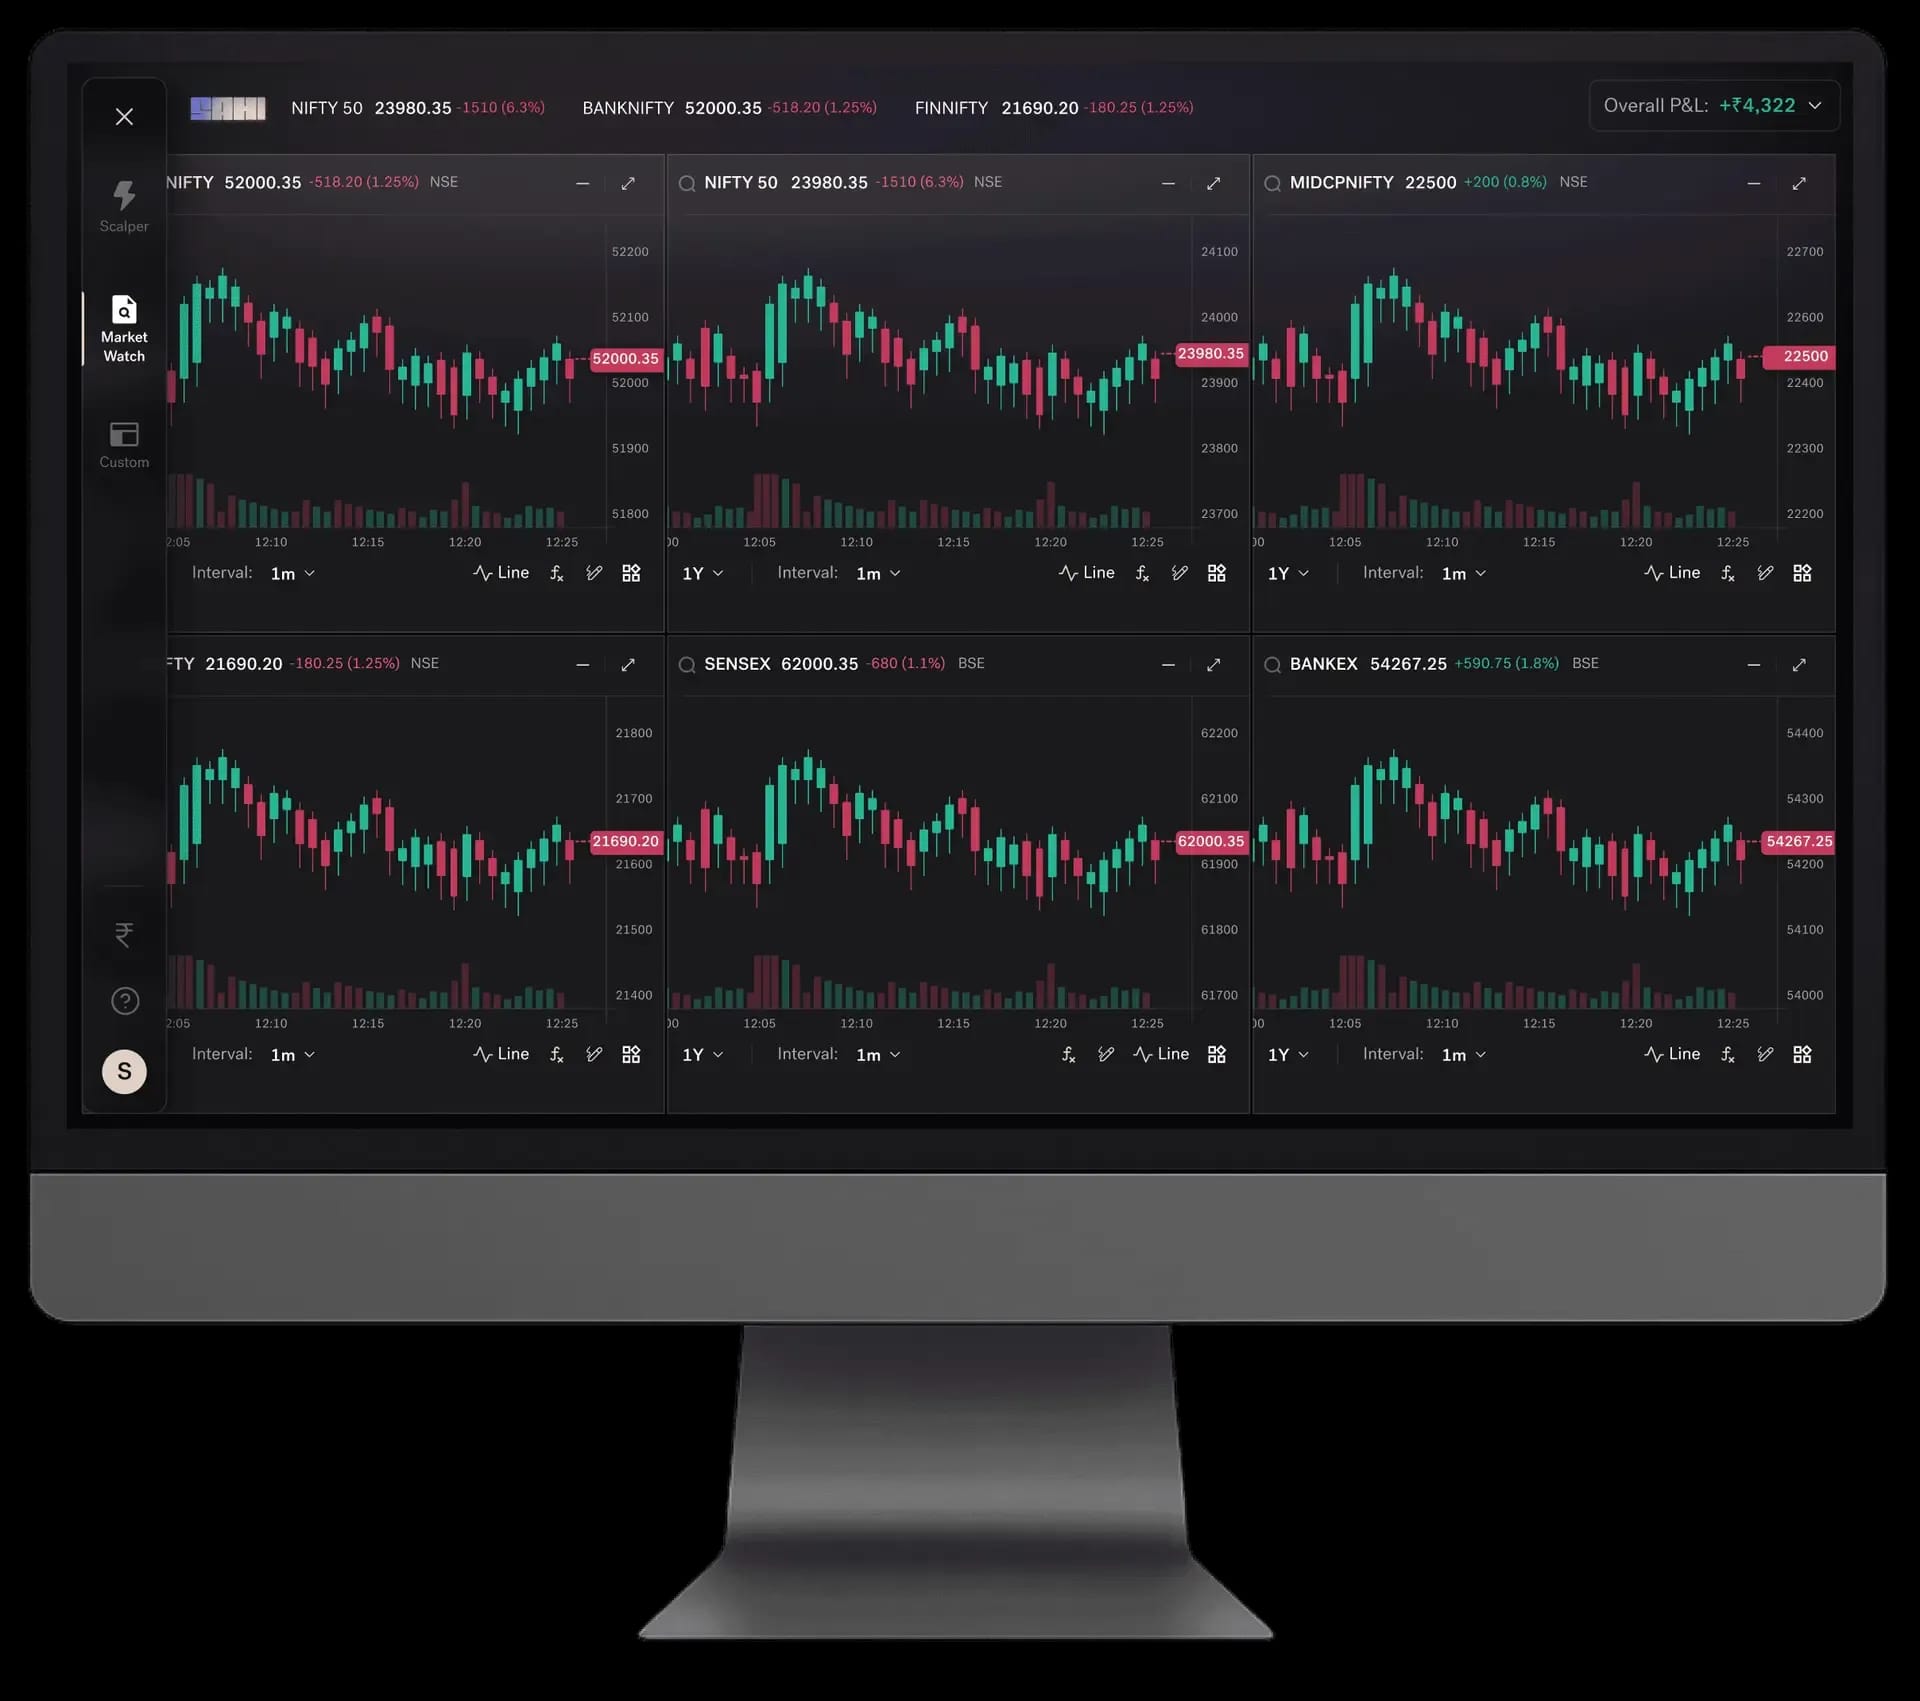
Single-screen workspace
Charts, orders, and positions together. Track up to six indices side by side on web — no tab-switching.
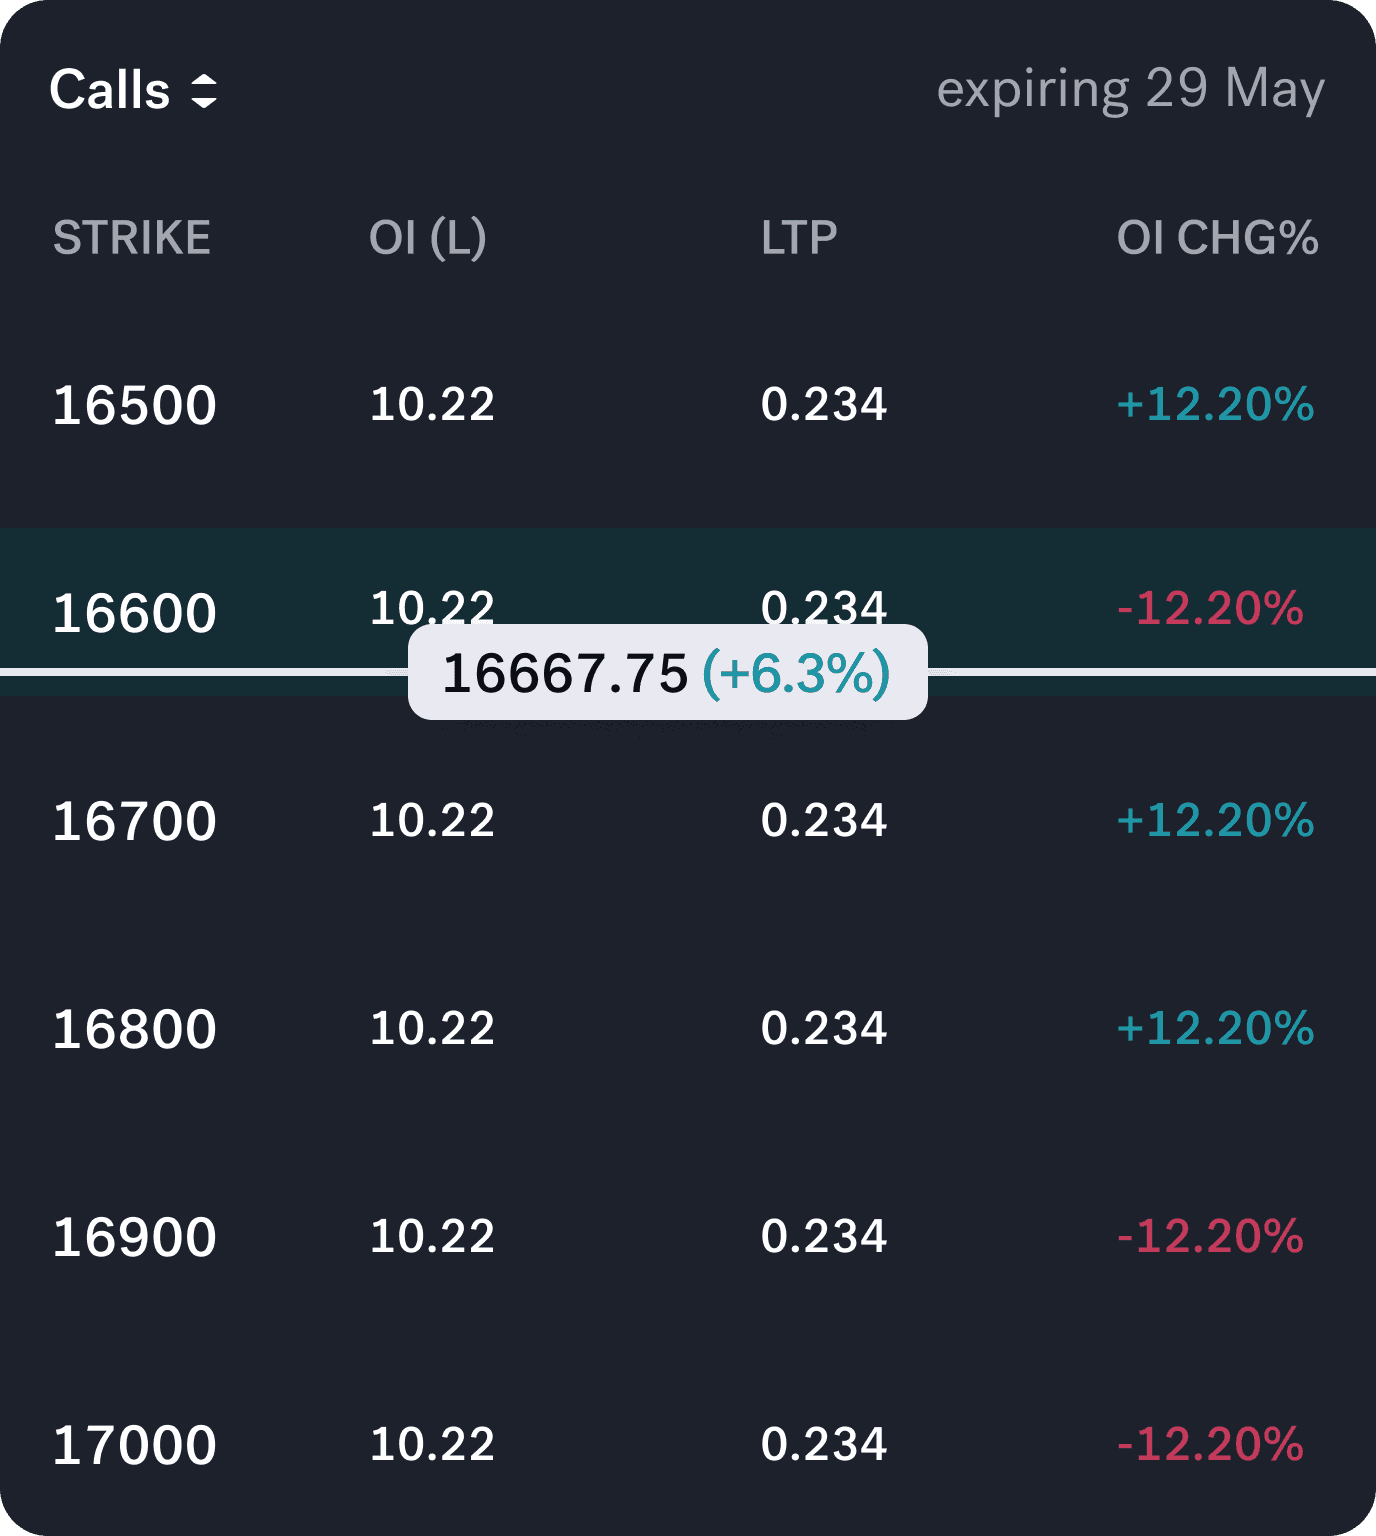
Open Interest on chart
OI is plotted directly on the chart, so you spot build-ups at support and resistance without opening the option chain.
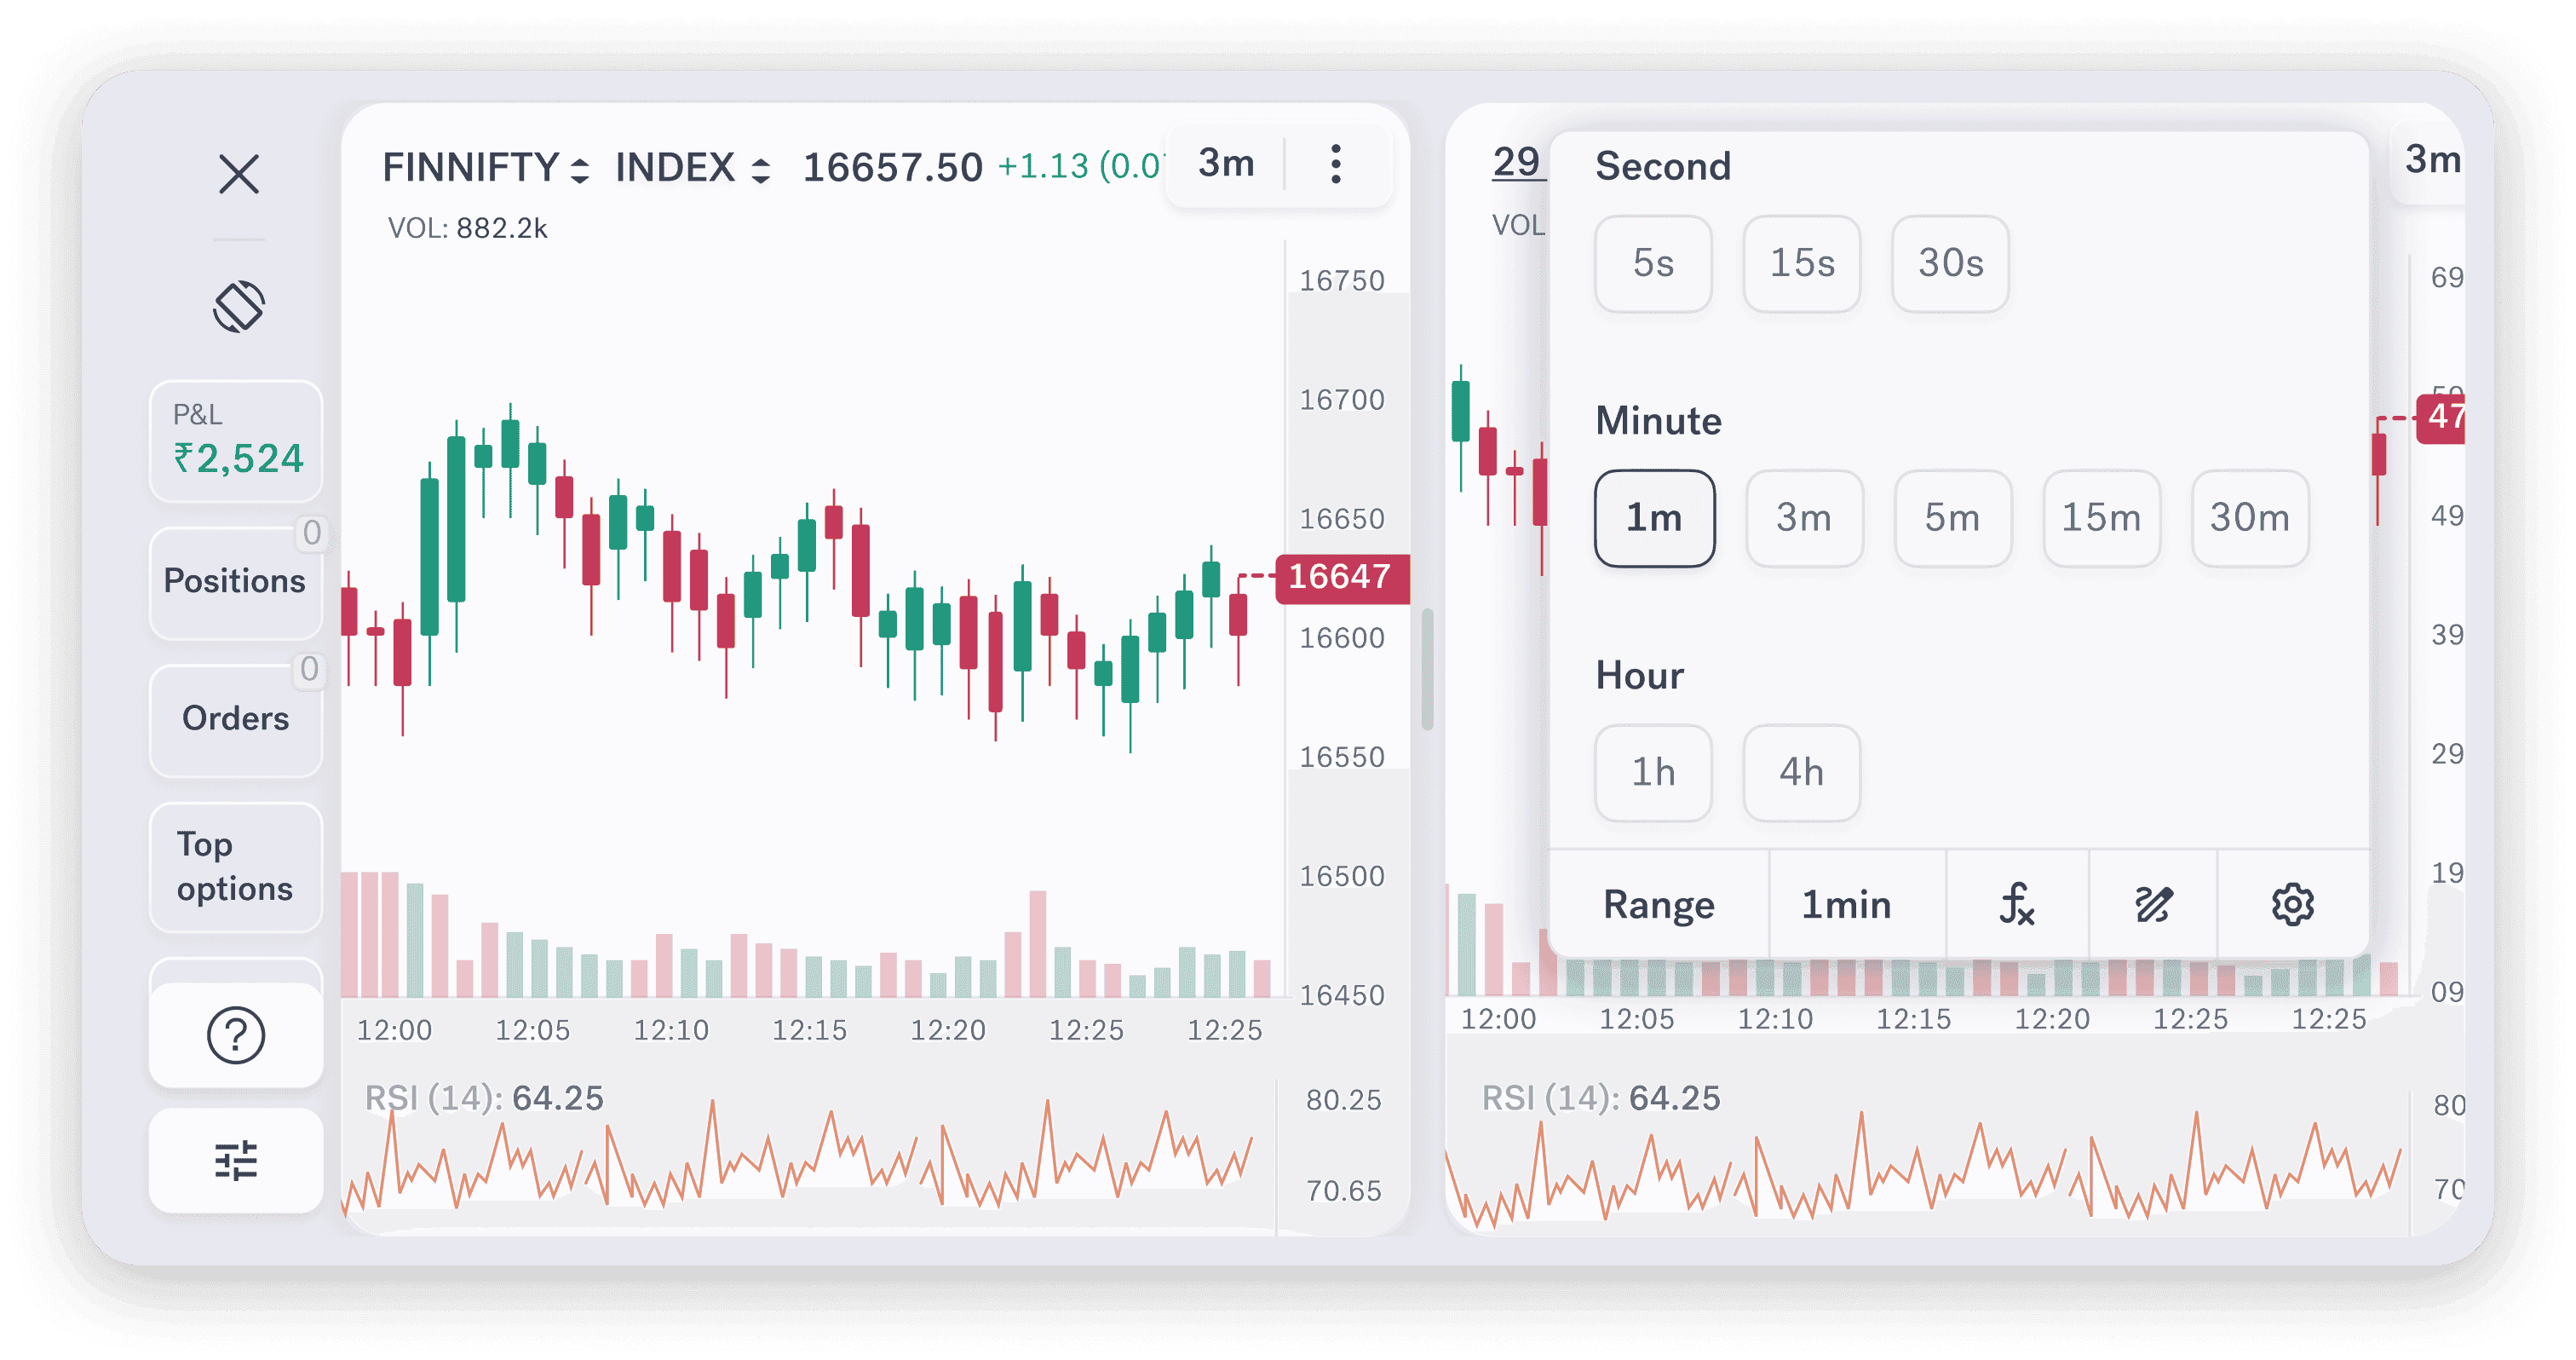
Seconds-level charts
Granular intraday data to time entries and exits — not chase a move after it has played out.
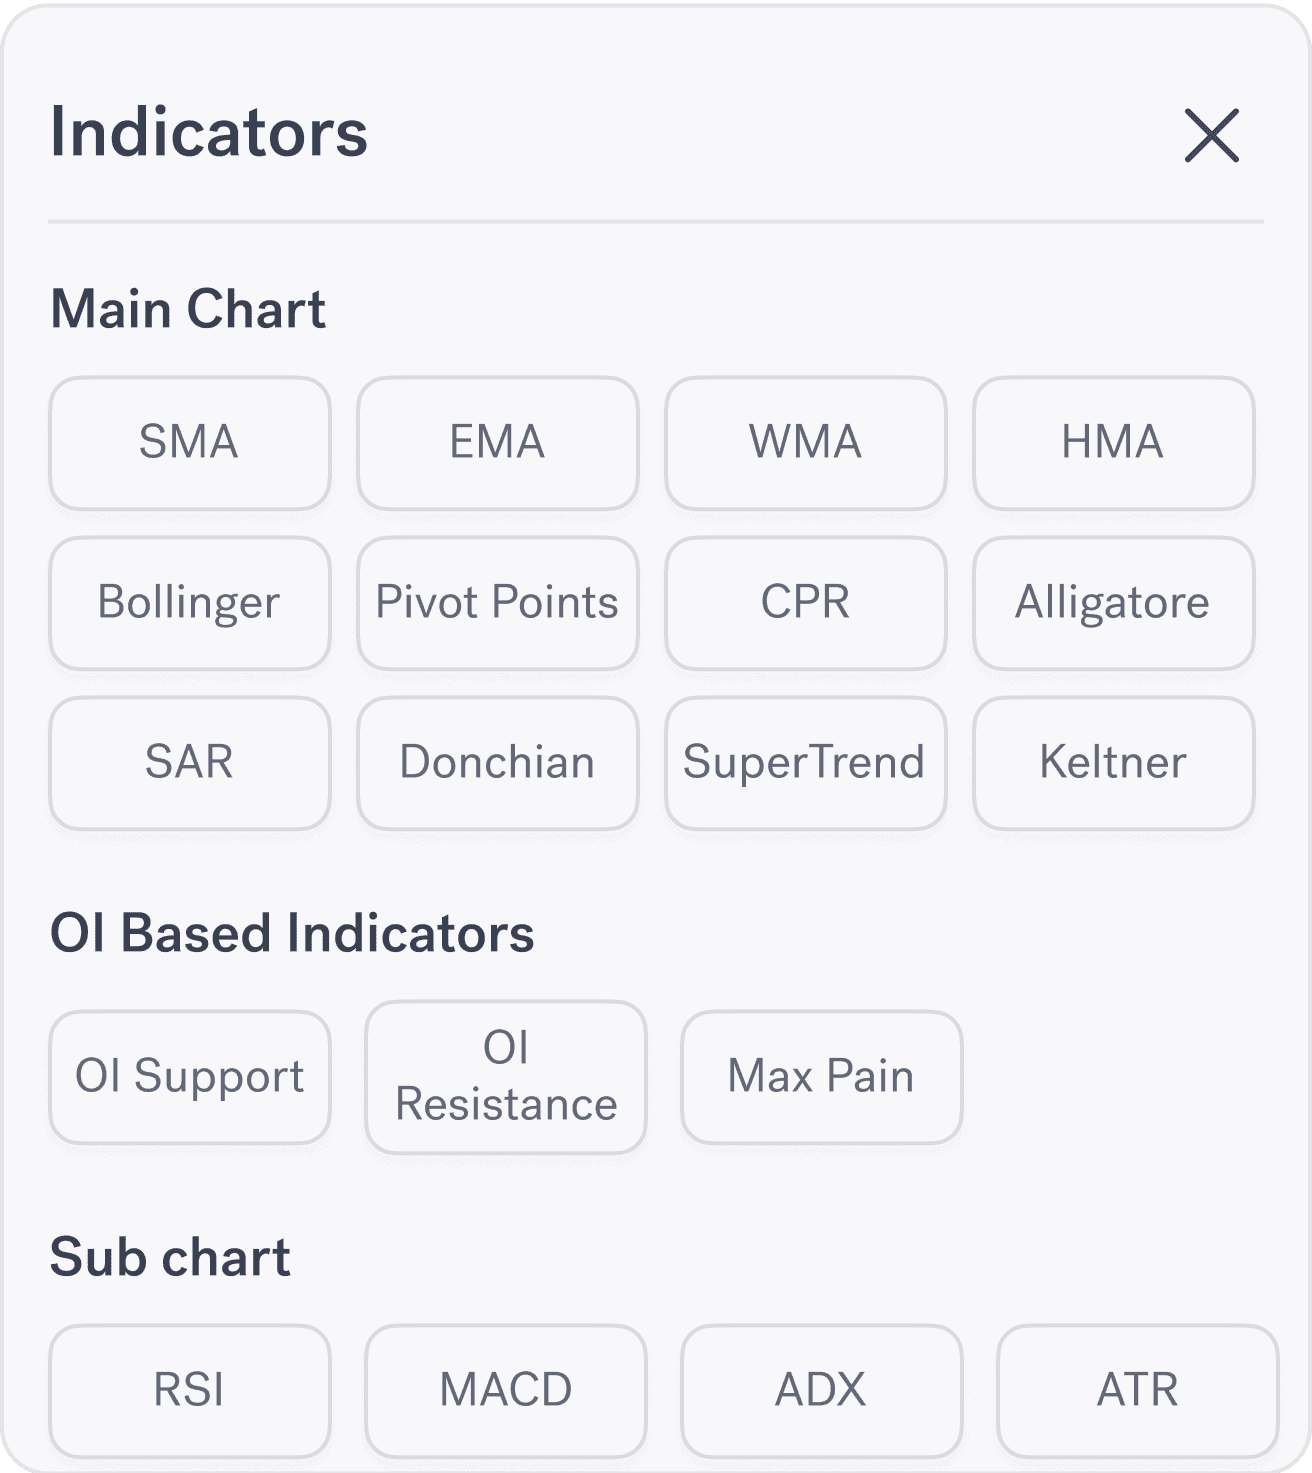
100+ indicators
Trend, momentum, volatility, volume, and risk tools in one place — VWAP bands, KAMA, Volume Profile, RSI Divergence, and more.
Lock & sync drawings
Lock levels so a stray tap can't move them, and sync every drawing in real time across mobile, web, and layouts.
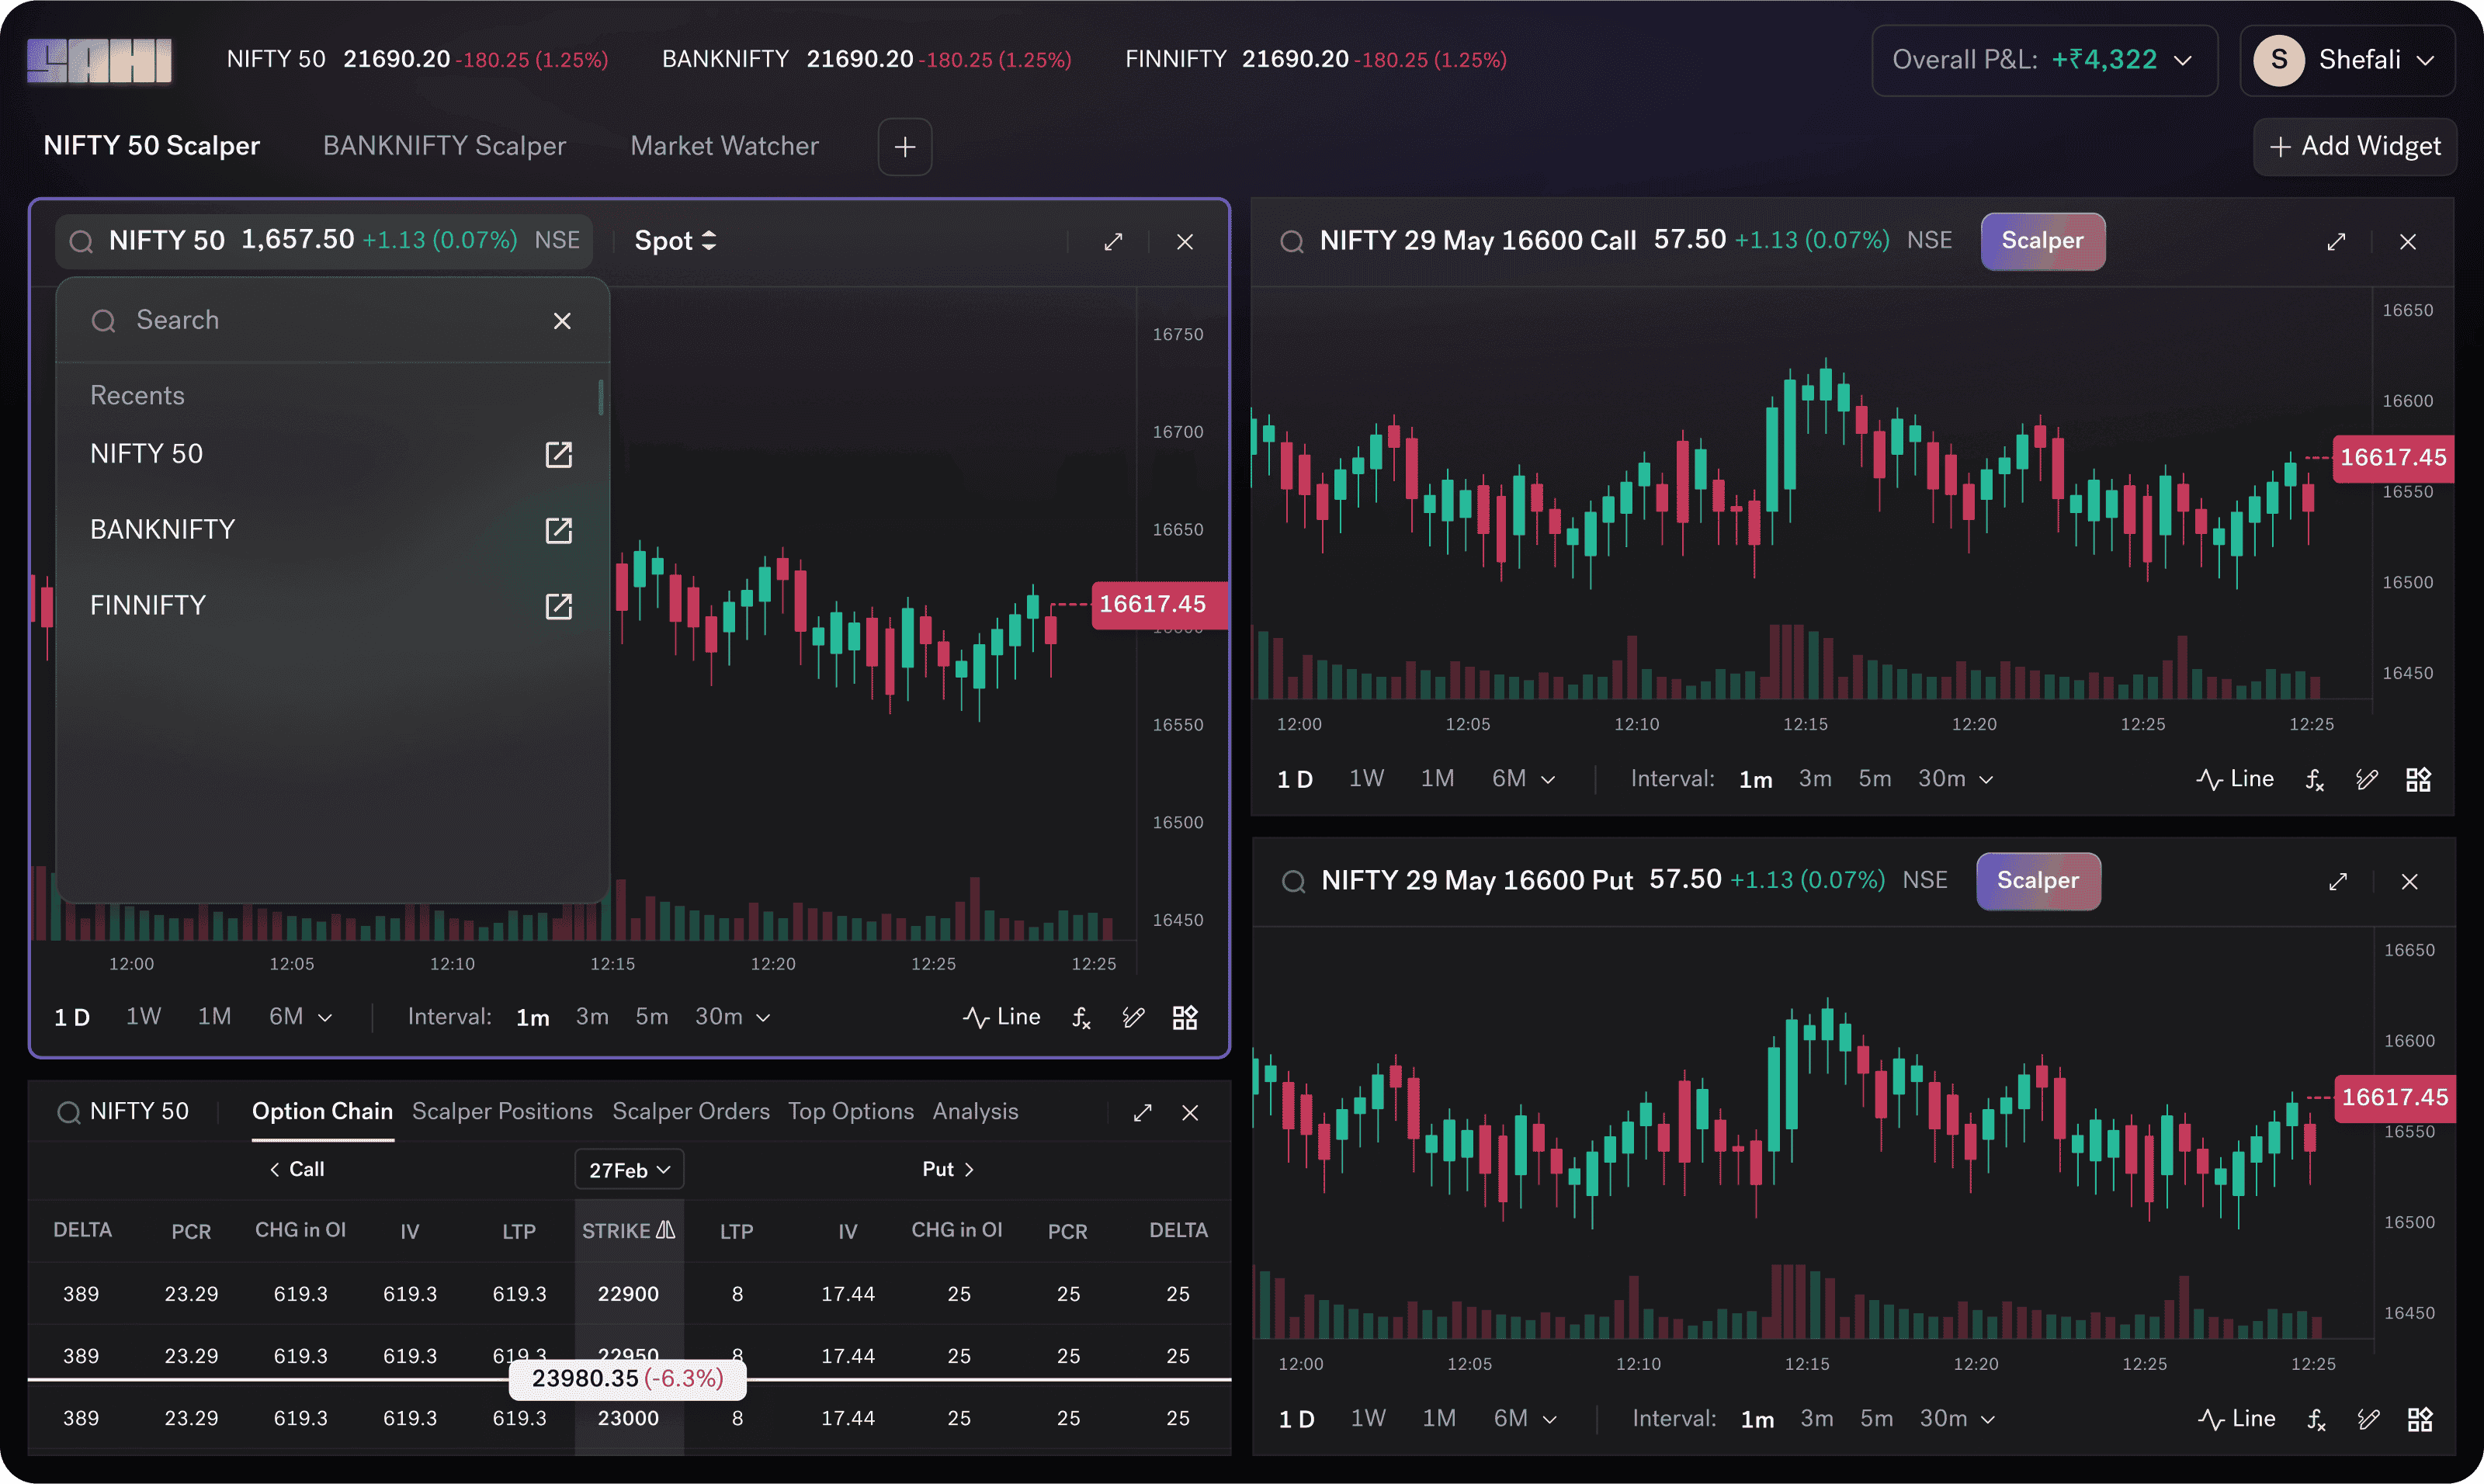
Single screen trading from charts - no more switching
Sahi Charts lets you place, modify, and exit orders without leaving the chart. Order entry, stop-loss, take-profit, and trailing stop-loss are all set and adjusted on the chart itself - the same screen where your analysis lives.
How chart-based order placement works
Tap or click any point on the chart to open the order panel inline. Set quantity and order type, then confirm without navigating away. Stop-loss and take-profit levels are draggable — pull them to the exact price you want, visually, while watching the chart update in real time.
Positions as chart overlays
Open positions are drawn directly on the chart — entry price, live P&L, stop-loss line, and target line all visible at a glance. Modify or exit from the overlay itself. No separate positions tab to open, no screen to switch to.
Trailing stop-loss on the chart
Set the trail distance in points, adjust how aggressively it follows, and watch it move with the position in real time — all directly on the chart. No separate order modification screen required.
One system, not two tools connected by an API
Chart-to-order works because Sahi's charting engine and order management system share the same infrastructure. The result: 6.61ms P95 order latency from EMS to exchange, measured over 9 million orders and published publicly.
Seconds-Level Charts for Intraday Trading Action
Seconds-Level Charts for Intraday Trading Action
Seconds-level charts support short-term price analysis and precise intraday entry and exit timing.
Speed you can verify, not just trust
Speed you can verify, not just trust
Sahi published its real execution data: a 6.61 ms P95 from its servers to the exchange, measured over 9,089,472 orders - every order plotted for anyone to inspect.
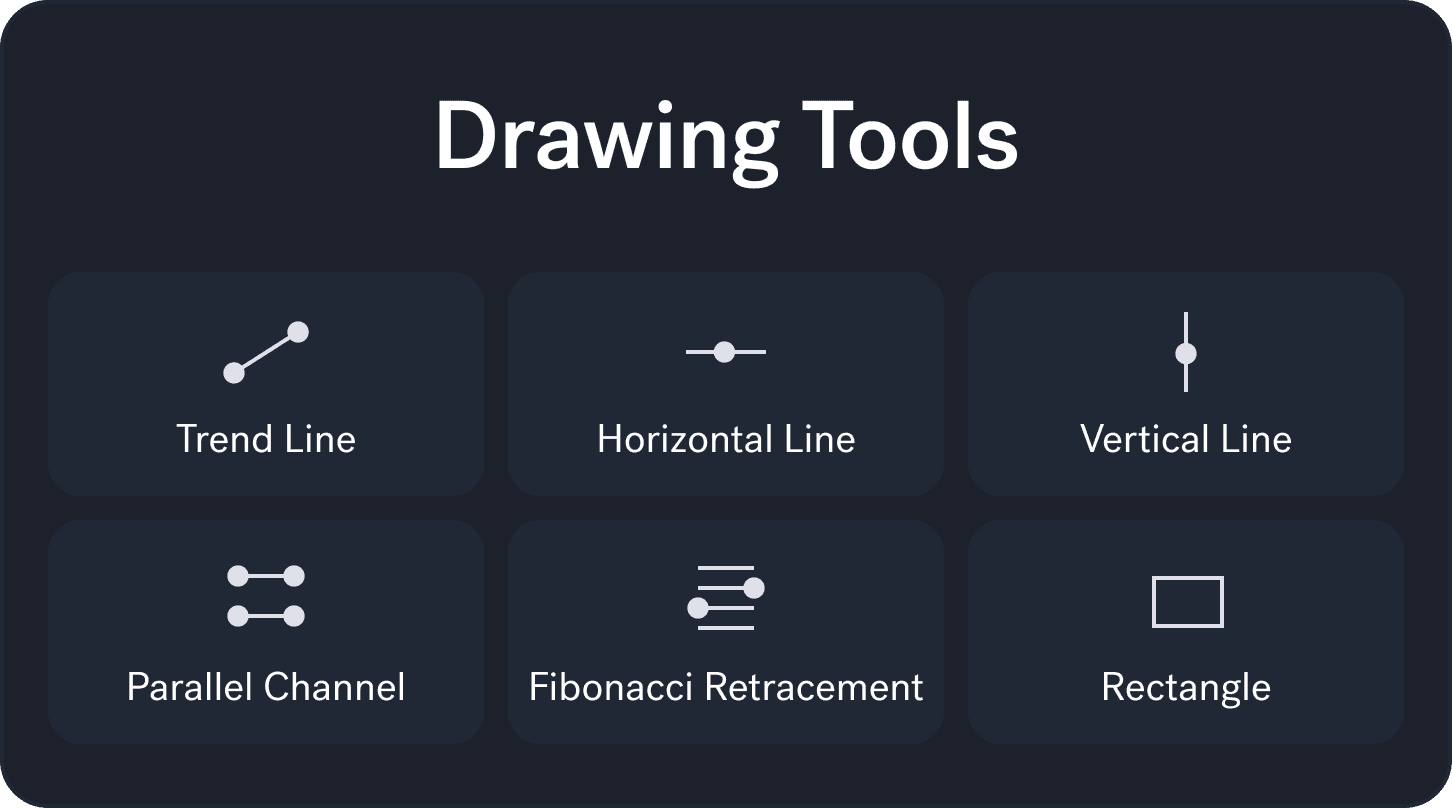
Indicators and Drawing Tools
Sahi charts include 20+ technical indicators to help you identify key levels and a full set of drawing tools to support structured chart analysis.
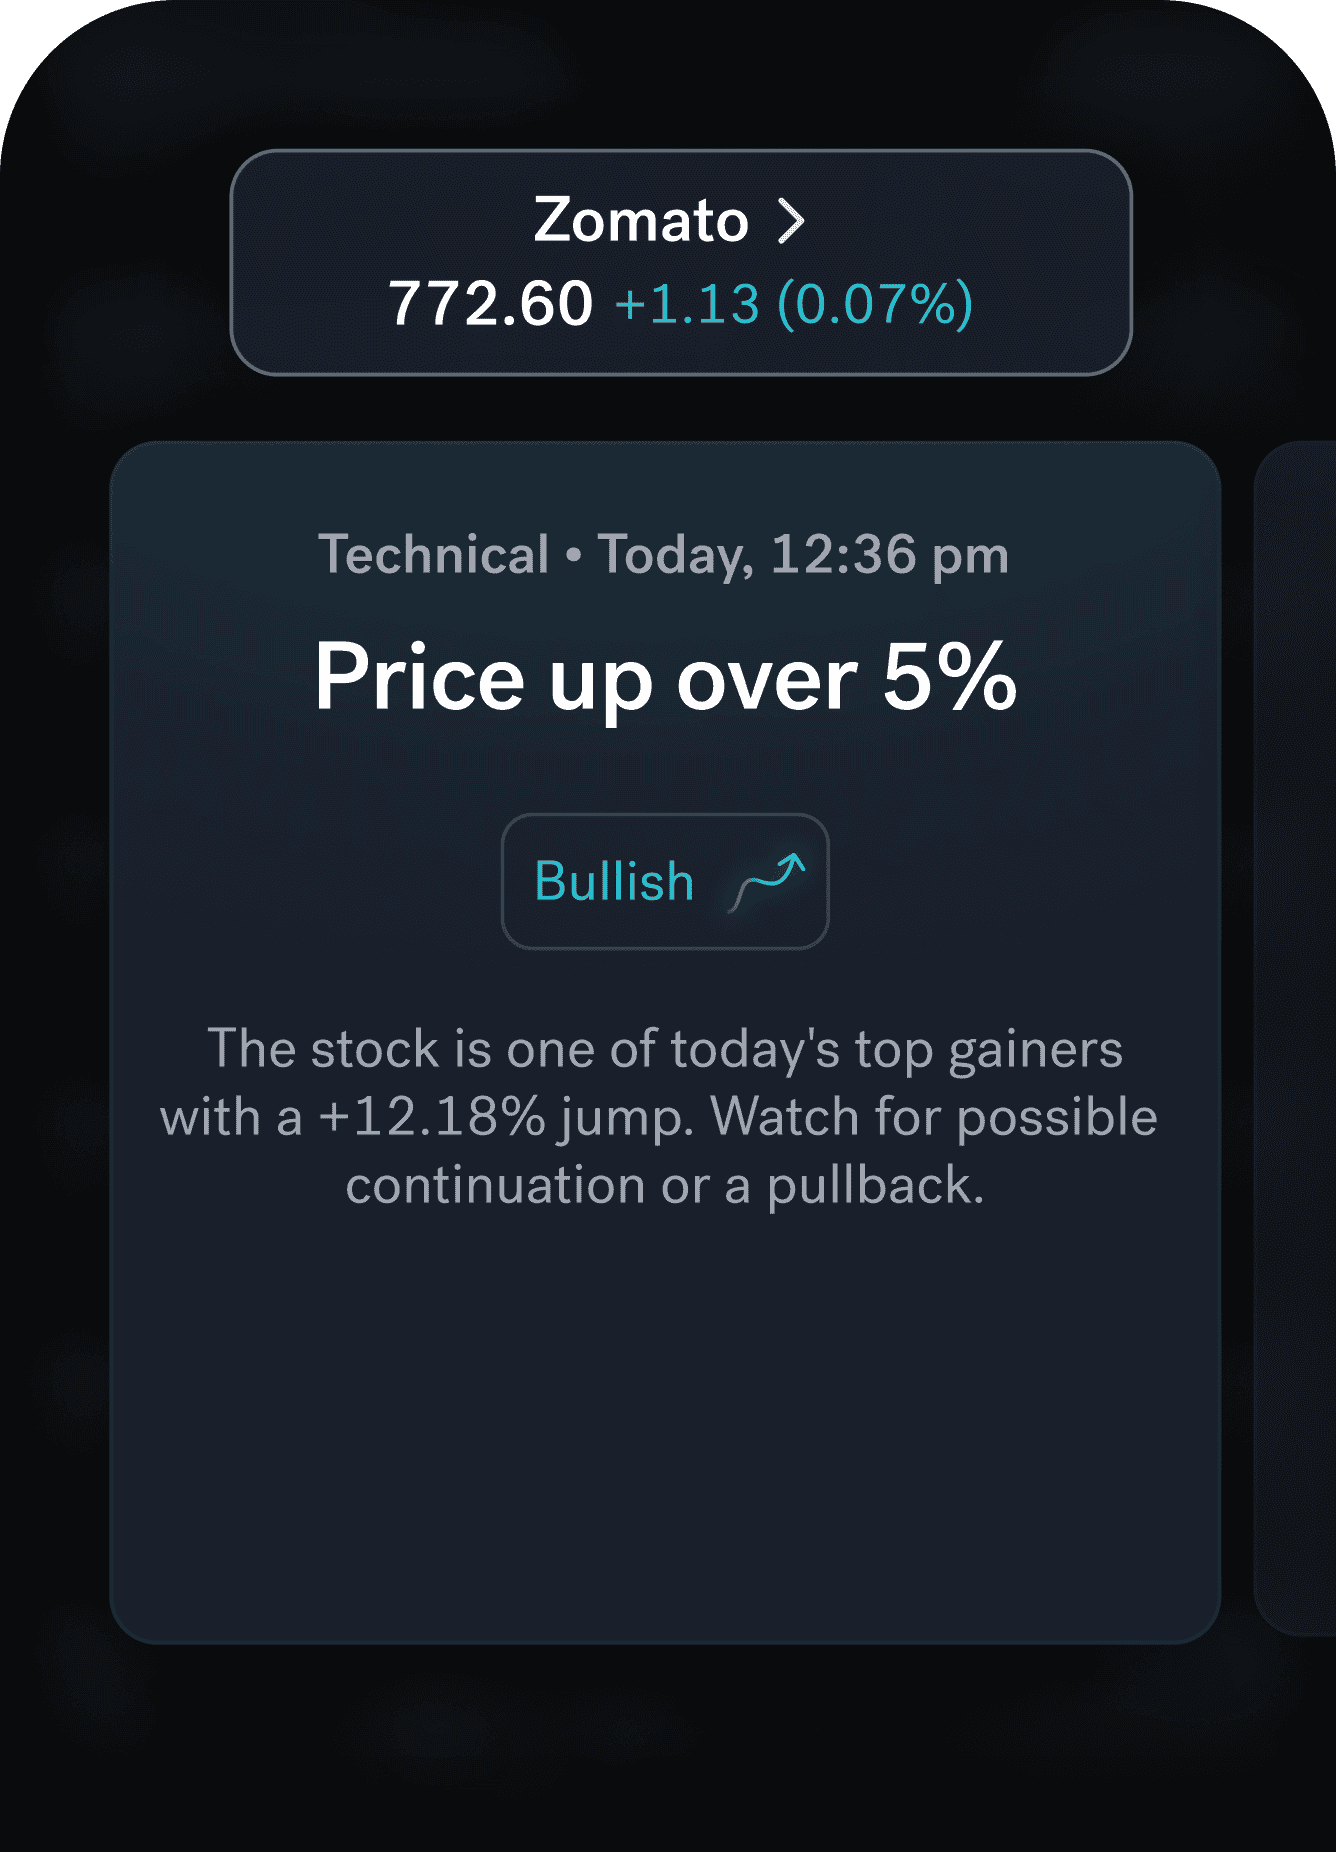
Technical Indicator Highlights
Certain indicators highlight notable market observations—such as changes in momentum or activity—based on predefined data conditions. These highlights support analysis, while all trading decisions remain fully with the trader.