
How to Read the Option Chain to Predict Market Moves in Weekly Expiries?
Most traders look at the option chain, but few use it to win. Learn how to decode open interest, implied volatility, and Greeks to find where money is positioned.
Team Sahi
Most traders look at the option chain every day. Very few traders actually use it to make better decisions.
Especially in weekly expiry markets, when profits are not decided by direction alone. They are often decided by where the money is already positioned, where fresh money is entering, and how quickly time decay is working against your strike. The option chain shows all of this in real time.
But first, let’s understand…
What Option Chain Really Is
The option chain is often explained as a simple table that shows call and put prices as well as the current number of open contracts across different strike prices. That description is technically correct but practically incomplete.
Think of the option chain as a complete menu card of all available call and put option contracts for a particular stock or index like Nifty or Bank Nifty. It also has different strike prices, expiration dates, and premiums (what it costs to place that bet). The option chain displays everything in one organised table so you can quickly see important details like the last traded price, how many people are buying and selling (volume), total open contracts (open interest), and how liquid each option is, helping you decide which specific option contract matches your market prediction and budget.
This is why professional traders treat the option chain as a positioning map rather than a price table.
While this sounds really interesting, let’s understand how to actually understand the numbers on an option chain.
Anatomy of an Option Chain (Understanding the Columns)
At first glance, the option chain might look crowded with numbers. But each column has a very specific role in telling you how the market is positioned.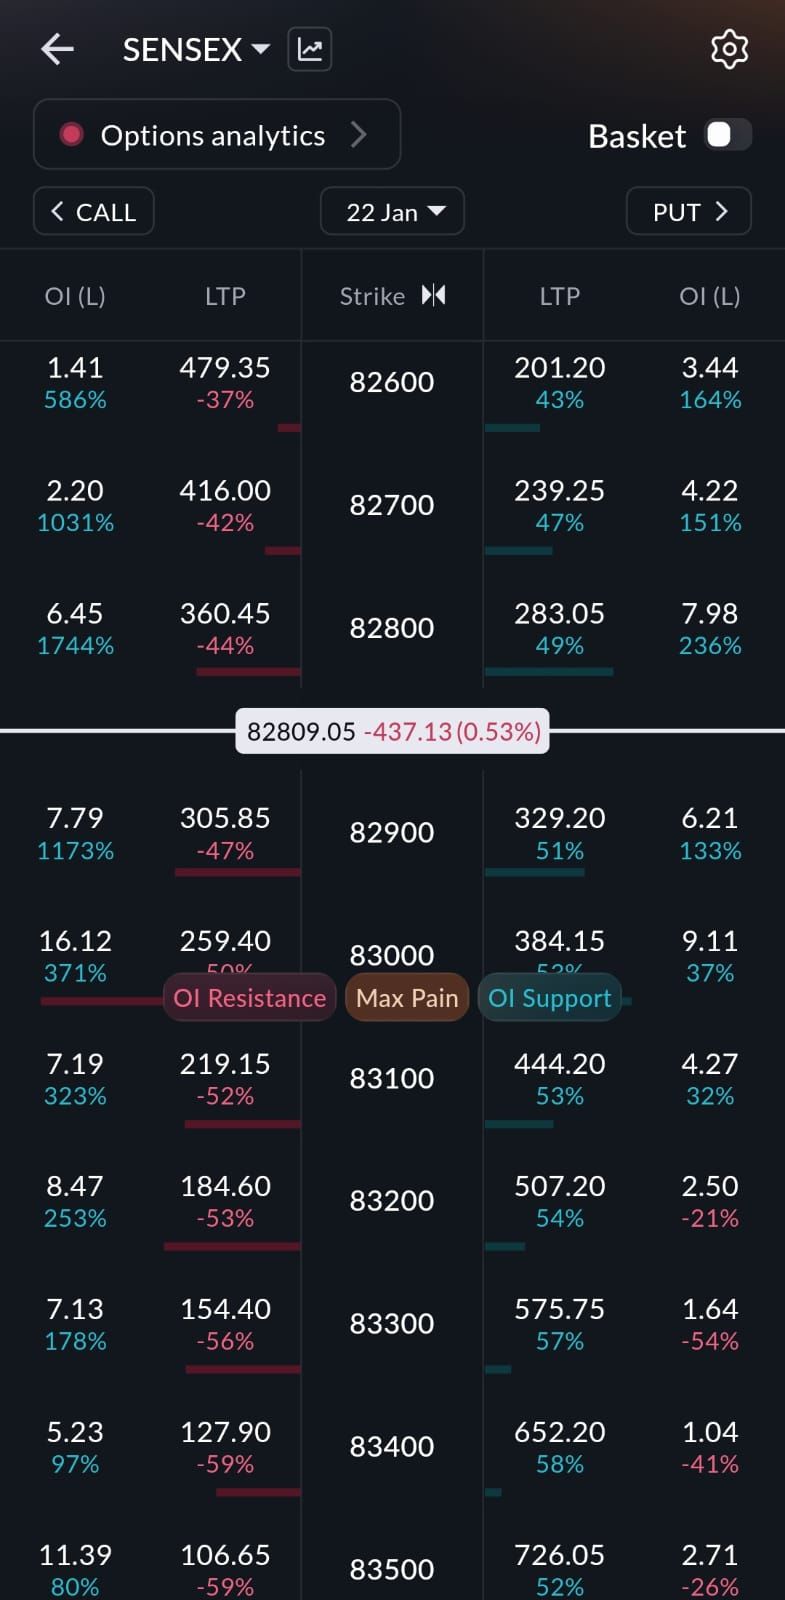
Every number in the chain represents a real position that someone is holding with real capital. In the option chain, open interest shows how much capital is already committed at each strike. Change in open interest shows where fresh positions are being created right now. Implied volatility shows how expensive protection and speculation have become. Together, these tell you far more than price alone ever can.
Open interest represents the number of active contracts currently held at each strike. High open interest means that a large amount of money is already committed there. You can also determine the current ATM (At The Money) option by locating the strike price that is closest to the current price. These zones often behave as strong support or resistance because many traders have risk tied to those levels.
Similarly, for call options (CE), all strikes below the current price are ITM (In The Money), and for put options (PE), all strikes above the current price are ITM.
To learn more about moneyness, read here.
Then the IV, or implied volatility, is a percentage that shows how much the market expects the stock or index to swing in the near future. Think of it as a "nervousness "meter"—higher IV means the market expects big price movements (up or down), while lower IV means calm, stable trading is expected.
Furthermore, the change in open interest shows what is happening right now. An increase indicates that new positions are being created. A decrease shows that traders are exiting or unwinding. This column is critical because it separates old positions from fresh intent.
Volume reflects current trading activity. High volume tells you where active buying and selling is taking place, while low volume often points to illiquid strikes that can cause slippage and unreliable price movement.
Implied volatility represents how expensive the option premium is. Rising volatility signals growing uncertainty or fear, while falling volatility suggests stability and premium compression.
Together, these columns explain not just what the price is, but why it is behaving the way it is.
What Makes Sahi’s Option Chain Different?
Most option chains show static numbers. They tell you how much open interest exists, but not what is happening right now.
Sahi’s option chain is built around flow. It does not only show where positions exist; it shows how they are changing in real time, and the best part is you can place your trades directly from the option chain.
Another highlight on the platforms is that now you can customise the open interest page as per your requirements.
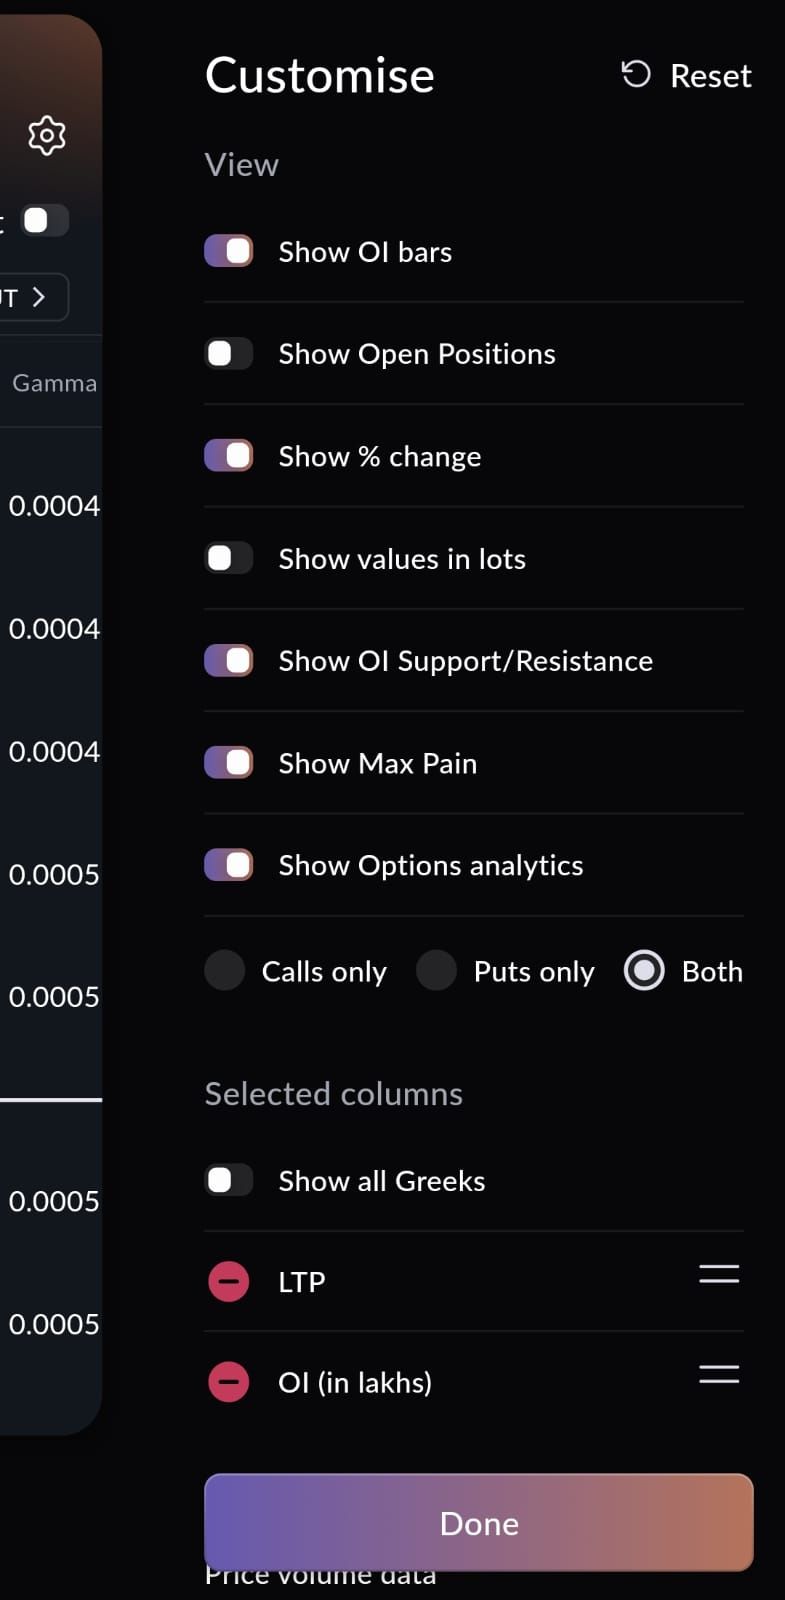
There are a range of options on the Sahi app that you can choose from to customise your option chain, specific to your needs.
Furthermore, Greeks are displayed directly inside the option chain so you can see how sensitive each strike is to price movement, time decay, and volatility. Instead of guessing which strike will react faster, you can identify it directly from the chain.
Sahi also shows your live position P&L directly inside the option chain. This allows you to track your exposure across strikes without switching screens.
Together, this turns the option chain into a live trading desk rather than just a reference table.
The Three Forces That Control Option Chain Behaviour
Every option chain is controlled by three forces: time, volatility, and direction. Price movement is only one part of this equation. The option chain shows how these three forces are interacting at every strike.
Time controls how quickly option premiums decay. This decay is strongest at at-the-money and near-the-money strikes, which is why open interest often concentrates around them. As expiry approaches, even a small delay in entry can reduce the probability of profit.
Volatility controls how expensive options become. When implied volatility rises, premiums expand even if price has not moved significantly. When volatility falls, premiums compress. This is why traders sometimes see losses even when the market moves in their favour.
Direction controls where traders place new positions. This is reflected through change in open interest and build-up data. Rising open interest with rising price usually indicates fresh long positions. Rising open interest with falling price usually indicates fresh short positions. These combinations reveal whether the market is building strength or distributing risk.
Reading Market Direction Using the Option Chain
In an option chain, direction is not guessed; it is observed. Moreover, successful traders always read the option chain and interpret it in a better way, which gives them an added edge.
You can also gain that by looking at various things like;
The most common strategy is spotting max pain in the option chain but that includes a lot of manual effort; however, you can now eliminate the entire process and just spot it on the Sahi app with just a toggle in the settings.
Traders also watch OI buildup vs. price movement on the option chain - if Nifty is rising but Call OI is increasing heavily, this indicates fresh call writing, and it signals resistance and potential reversal. Conversely, a rising price with Put OI buildup indicates strong support.
Smart traders also monitor sudden OI changes in real-time, which can be easily spotted on the app. For instance, if 23,600 CE suddenly adds 10 lakh OI in 30 minutes while the premium is falling, it means big players are aggressively writing calls, expecting Nifty won't cross 23,600—that becomes a strong resistance for intraday trading.
Finally, they compare bid-ask spreads and volume—tight spreads with high volume mean liquid options perfect for quick entries/exits, while wide spreads indicate illiquid strikes to avoid.
By reading these patterns together—OI, volume, IV, and price action—experienced traders decode where big money is positioned and trade accordingly rather than blindly buying calls or puts.
How Professionals Actually Use the Option Chain
Professional traders do not use the option chain to hunt for cheap premiums. They use it to structure their trades.
The first step is to use it for directional confirmation. Before taking a directional trade, they check whether fresh open interest is supporting the move.
The second use is hedge placement. Traders use the option chain to identify where protection is cheapest and where risk will expand fastest. Rising volatility and build-up patterns help decide whether hedges should be placed closer to the market or further away.
The third use is strike selection. Greeks inside the option chain allow traders to compare how fast different strikes will react to price, time, and volatility. This helps in choosing strikes that match the intended strategy instead of blindly buying near-the-money or deep out-of-the-money options.
Strategy Mapping Using the Option Chain
Once you understand how positioning and volatility are distributed across strikes, the option chain becomes a tool for selecting the right structure rather than guessing individual options.
When call-side open interest is heavily concentrated above the current market price, it usually indicates strong overhead supply. In such conditions, limited-risk bearish strategies such as bear call spreads often work better than naked call buying.
When put-side open interest is building below the market price and volatility is stable or falling, the market is usually showing a supportive structure. In such cases, bull put spreads tend to offer better probability than aggressive call buying.
If volatility is rising sharply and both sides of the option chain are seeing fresh build-up, it often indicates expectation of a large move. In such environments, long straddles or strangles become more relevant.
When volatility is elevated and open interest remains stable without fresh buildup, the market is often in a range with high premium levels. This is where non-directional strategies such as iron condors are more appropriate.
Common Option Chain Mistakes Traders Make
While there are multiple mistakes, some of the common ones include:
- Treating the option chain as a price list—Traders often select strikes only because the premium looks cheap, without considering where open interest is concentrated or how fast time decay is working against that strike.
- Blindly following the put–call ratio without checking where fresh positions are actually being created—a high or low PCR on its own does not indicate direction unless it is supported by change in open interest and buildup patterns.
- Ignoring implied volatility and Greeks—This leads to buying options that are already expensive or selling options where risk can expand sharply.
- Entering strikes with low liquidity—These strikes may show attractive premiums but suffer from wide bid–ask spreads, poor execution, and unpredictable price movement.
Avoiding these mistakes alone can significantly improve strike quality and risk control.
Therefore, to summarize, the option chain reveals where capital is placed, how volatility is evolving, and where pressure is building in real time. It shows whether moves are supported by fresh positions or are only temporary price reactions. It also helps identify where decay will be strongest and where risk will expand fastest.