
Golden Cross vs Death Cross: How Traders Spot Trend Reversals
SAHI
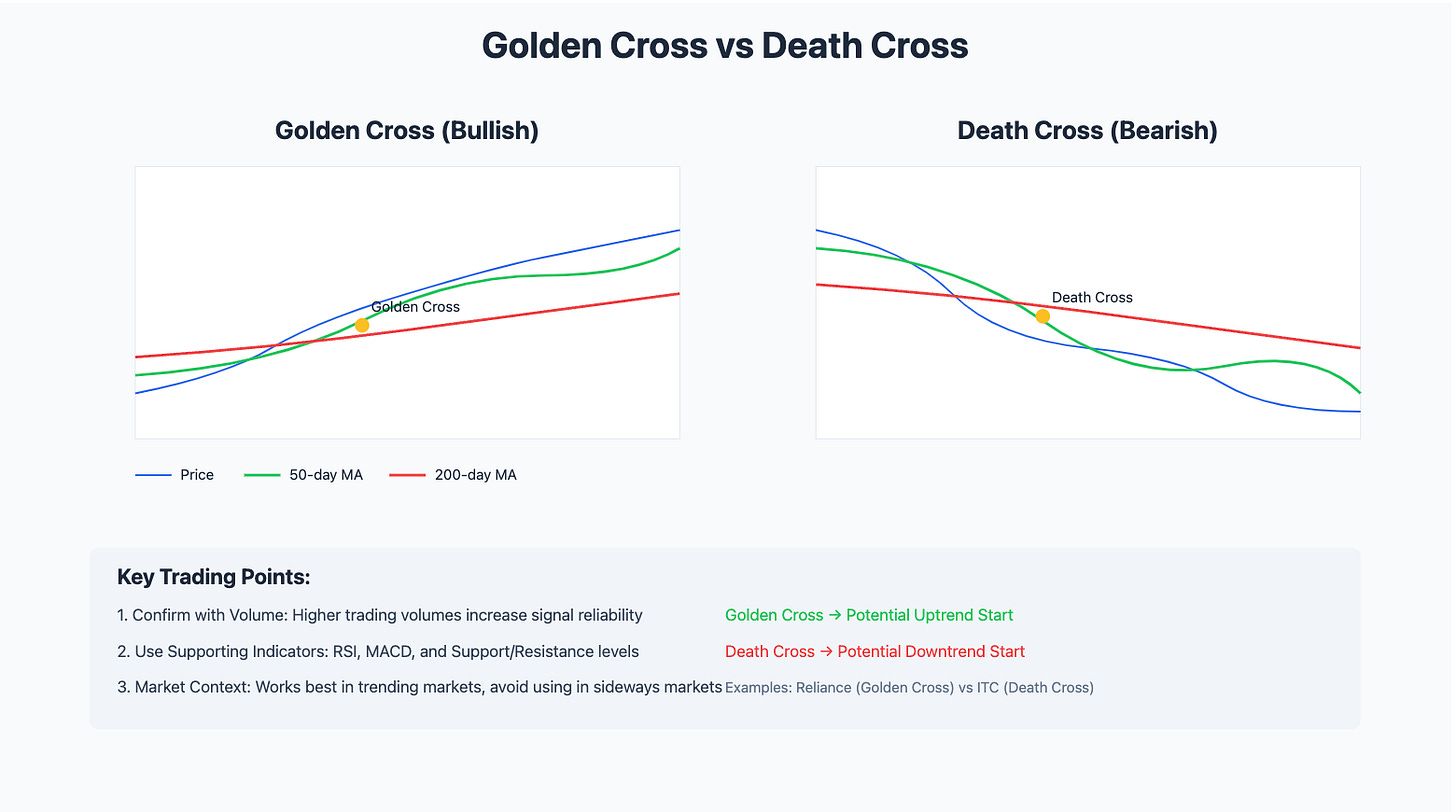
A Golden Cross occurs when a short-term moving average (e.g., 50-day MA) crosses above a long-term moving average (e.g., 200-day MA) from below.
👉 It signals the start of an uptrend, suggesting that bullish momentum is building up.
A death cross happens when a short-term moving average (e.g., 50-day MA) crosses below a long-term moving average (e.g., 200-day MA) from above.
👉 It signals the start of a downtrend—indicating that selling pressure might increase.
✅ Step 1: Confirm the Crossover
-
Higher volume during the crossover = More reliable signal
✅ Step 2: Pair with Other Indicators
-
Use RSI (Relative Strength Index), MACD (moving average convergence divergence), and support-resistance levels.
-
Example: If RSI is below 40, MACD forms a negative crossover, and there’s a breakdown of key support levels—a Death Cross strengthens the sell signal.
✅ Step 3: Trending Markets Work Best
-
Golden & Death Crossovers work best in trending markets.
-
They may fail in sideways conditions—so always confirm with other indicators!
🔹 Golden Crossover in Nifty 50
-
If Nifty 50 forms a Golden Cross (50-day MA crosses above 200-day MA), traders may anticipate buying interest and enter long positions.
🔹 Death Crossover in Nifty 50
-
If 50-day MA crosses below 200-day MA, traders may expect further downside and look for short-selling opportunities.
📌 PS: In a recent Sahi.com analysis,
-
Reliance showed a Golden Cross ✅

-
ITC formed a Death Cross ❌

The next time you see a Golden or Death Crossover, will you follow the trend? Or will you look deeper before taking action? 🔥 Let’s discuss!