
Sell-off Drags Nifty50 Below 26,050 as Caution Sets In
Team SAHI
Nifty: 26,042.30 ▼ -0.38%
Sensex: 85,041.45 ▼ -0.43%
Bank Nifty: 59,011.35 ▼ -0.29%
Market Today: Caution sets in as Nifty50 breaks below 26,050, What’s next?
The Nifty breached its 20-DEMA intraday, weighed down by selling pressure in IT and Auto stocks. Market breadth remained weak, with the NSE advance-decline ratio at 1:2.
On the weekly chart, Nifty formed a long upper-wick candle, highlighting strong supply at higher levels. Bank Nifty is now approaching its previously discussed demand zone near 58,650–58,800, while Sensex mirrors Nifty’s structure.
Holding above key support levels will be critical. A failure to do so could shift the indices into a time-wise corrective and consolidation phase.
Key Levels to Watch for December 29, 2025
| Index | Support | Resistance |
|---|---|---|
| Nifty | 25,965 & 25,880 | 26,100 & 26,180 |
| Bank Nifty | 58,800 & 58,650 | 59,100 & 59,275 |
| Sensex | 84,750 & 84,500 | 85,350 & 85,500 |
Sector & Stock Moves: Where was the action?
IT and Auto stocks led the decline, with Coforge slipping 3.71% ahead of a proposed fundraising meet and the potential acquisition of Encora. Metals and FMCG were the only sectors in green.
Railway stocks stood out on the upside, with RVNL jumping 12.22% as revised passenger fares came into effect.
Titan topped the Nifty gainers, rising 2.12% ahead of the launch of its lab-grown diamond store, while Dilip Buildcon gained 2.39% on multiple order wins exceeding ₹5,000 crore.
NIFTY50: Top Gainers
- TITAN ▲ +2.12%
- NESTLE ▲ +1.02%
- HINDALCO ▲ +0.98%
NIFTY50: Top Losers
- ASIANPAINT ▼ -1.40%
- SHRIRAMFIN ▼ -1.38%
- TECHM ▼ -1.18%
Open Interest Insights
Aggressive call writing at 26,100 (1.22 Cr) and 26,200 (68.17L) highlights a well-defined resistance zone, while limited put additions keep the PCR-OI subdued at 0.7.
What does this mean? It reflects cautious sentiment, where traders are positioning for a corrective move rather than an immediate directional trend.
Stocks on the Move
| Stock | % Gain / Loss | What’s happening? |
|---|---|---|
| RVNL | +12.22% | Double bottom breakout supported by railway fare revisions and rising Budget optimism |
| HINDCOPPER | +8.95% | Trading near a 15-month high after base breakout, driven by global copper prices |
| GMDC | +7.94% | Daily breakout above the 555 zone backed by strong volumes |
| NBCC | +5.08% | Structural breakout after reclaiming 120, with scope to test 130 |
| IEX | -2.72% | Supply pressure dragging the stock toward the lower end of its range near 132 |
News You Can Use
- Bondada Engineering bags ₹391 crore order from NTPC Green Energy.
- Colgate receives ₹268 crore tax demand order for FY 2021–22.
- Dilip Buildcon secures ₹3,400 crore EPC project LoA from Adani Road Transport.
Chart of the Day: TITAN (Daily Timeframe)
Spotted: Rounding base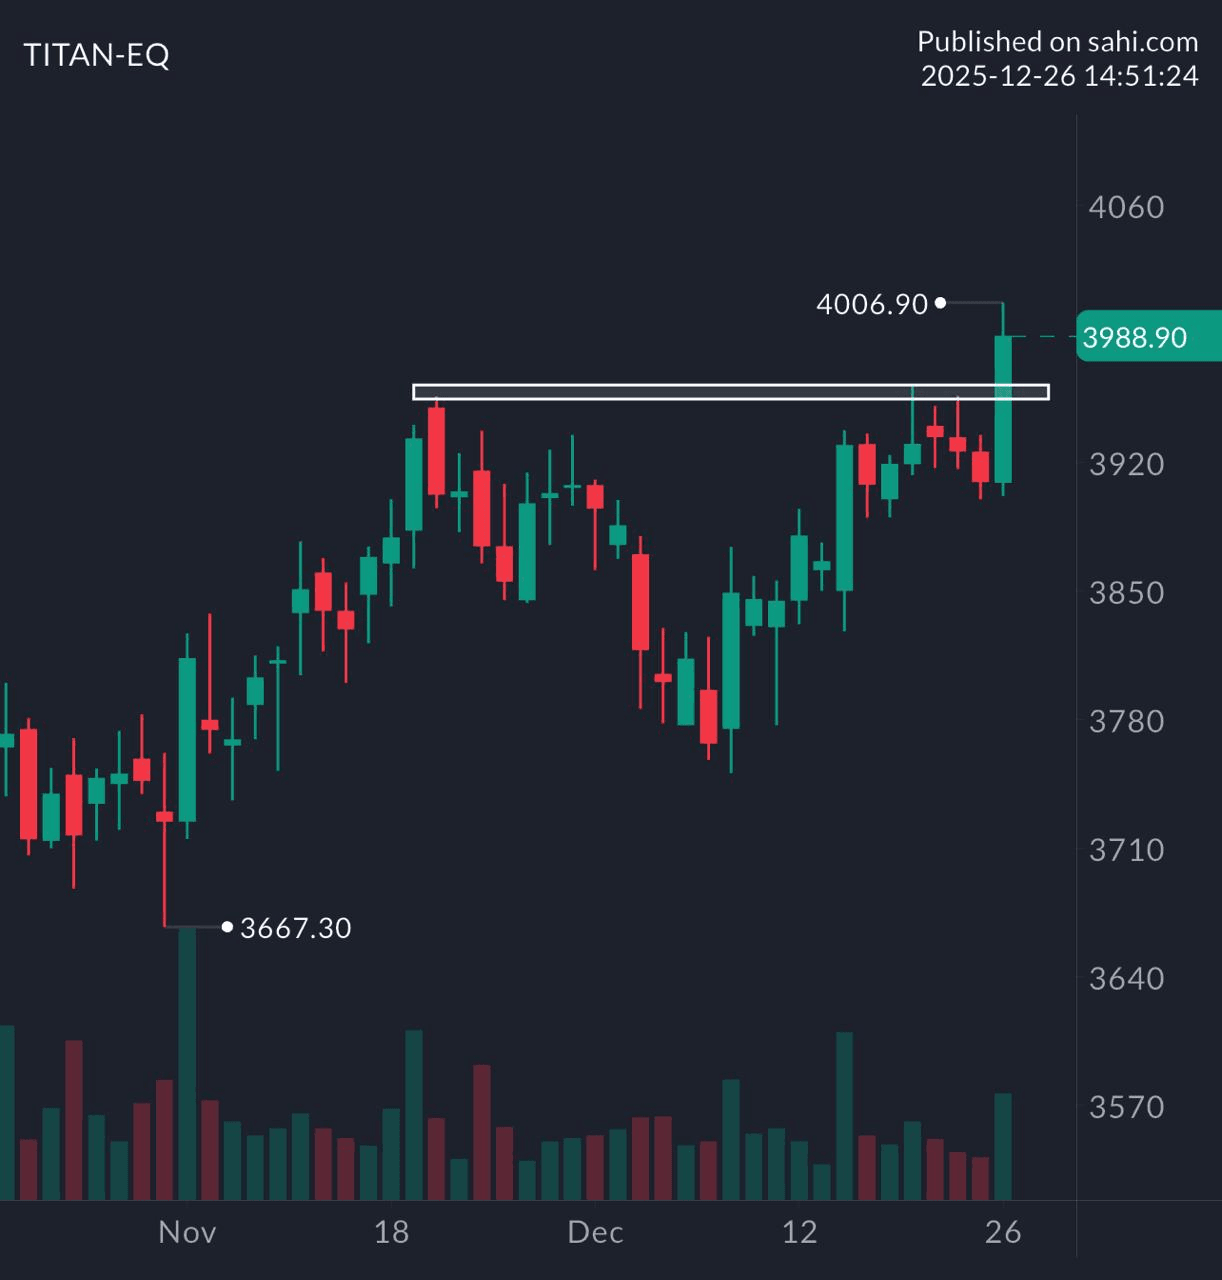
Structure: Price forms a smooth, rounded base, indicating gradual accumulation as selling pressure fades.
Validation: A breakout above the neckline, ideally with volume support, confirms trend continuation.
Trading Insight: A classic continuation setup where sustained accumulation often leads to strong follow-through.
Related
Recent
SEBI Regulation Margin Benefit Calendar: Expiry-Day Change for Single-Stock Spreads
RBI MPC February 2026: Repo Rate Held at 5.25% as RBI Prioritises Stability Over Fresh Easing
Indian Oil Q3 FY26 Results: Strong Earnings Momentum Driven by Refining Upswing and Government Support
Nykaa Q3 FY26 Results: Net Profit Surges 143% YoY to ₹63.3 Crore; Revenue Grows 26.7% to ₹2,873 Crore
PVR INOX Q3 FY26 Results: Reports Net Profit of ₹96 Crore; Revenue Jumps 9.7% YoY to ₹1,908 Crore