
IndiGo vs SpiceJet: Key Technical Levels to Watch After Recent Volatility
Team Sahi
Despite the recent hiccup in the news cycle, IndiGo’s stock has been one of the market’s more stable stories over the past year. Consistent demand recovery, better yields, and a dominant domestic market share helped it build a strong rally not a sharp spike, but a steady, well-supported climb.
Every rally, however, encounters moments where the market pauses to reassess. For IndiGo, that moment is now.
The ₹4,700 Level: More Than Just a Support Zone
This is not your typical pullback level. The ₹4,700 zone has a layered significance that traders respect:
- Historical demand zone: Buyers have stepped in here during previous corrections.
- 50-week EMA alignment: This long-term moving average is often treated as a “strength test” for a rally.
- Sentiment timing: It comes right after the IndiGo fiasco, meaning emotions and charts are intersecting at the same point.

In technical analysis terms, when price, moving averages, and sentiment converge at the same zone, it becomes a decision-making point.
If the stock respects this level:
- The correction remains healthy,
- Long-term trend stays intact,
- And dip-buying interest could resume.
If it breaks below ₹4,700 with momentum:
- The correction may deepen,
- The broader market may reassess IndiGo’s risk profile,
- And the stock may need more time to rebuild strength.
This is why the next few sessions matter so much.
IndiGo isn’t weak it’s being tested. And strong stocks do get tested.
SpiceJet: A Stock Still Trying to Escape Its Downtrend
While IndiGo’s pullback comes after a substantial rally, SpiceJet has been dealing with a completely different narrative one shaped by operational stress, cash flow concerns, and a long-standing battle with market confidence.
The chart reflects that story almost line for line.
A Downtrend With Persistent Pressure
For months, SpiceJet has been unable to break above its major weekly moving averages the 20, 50, and 200-week EMAs. These aren’t just technical markers; they reflect collective market memory, areas where sellers repeatedly regain control.
Every rally attempt has been short-lived.
Every bounce has been rejected.
Every breakout attempt has lacked conviction.
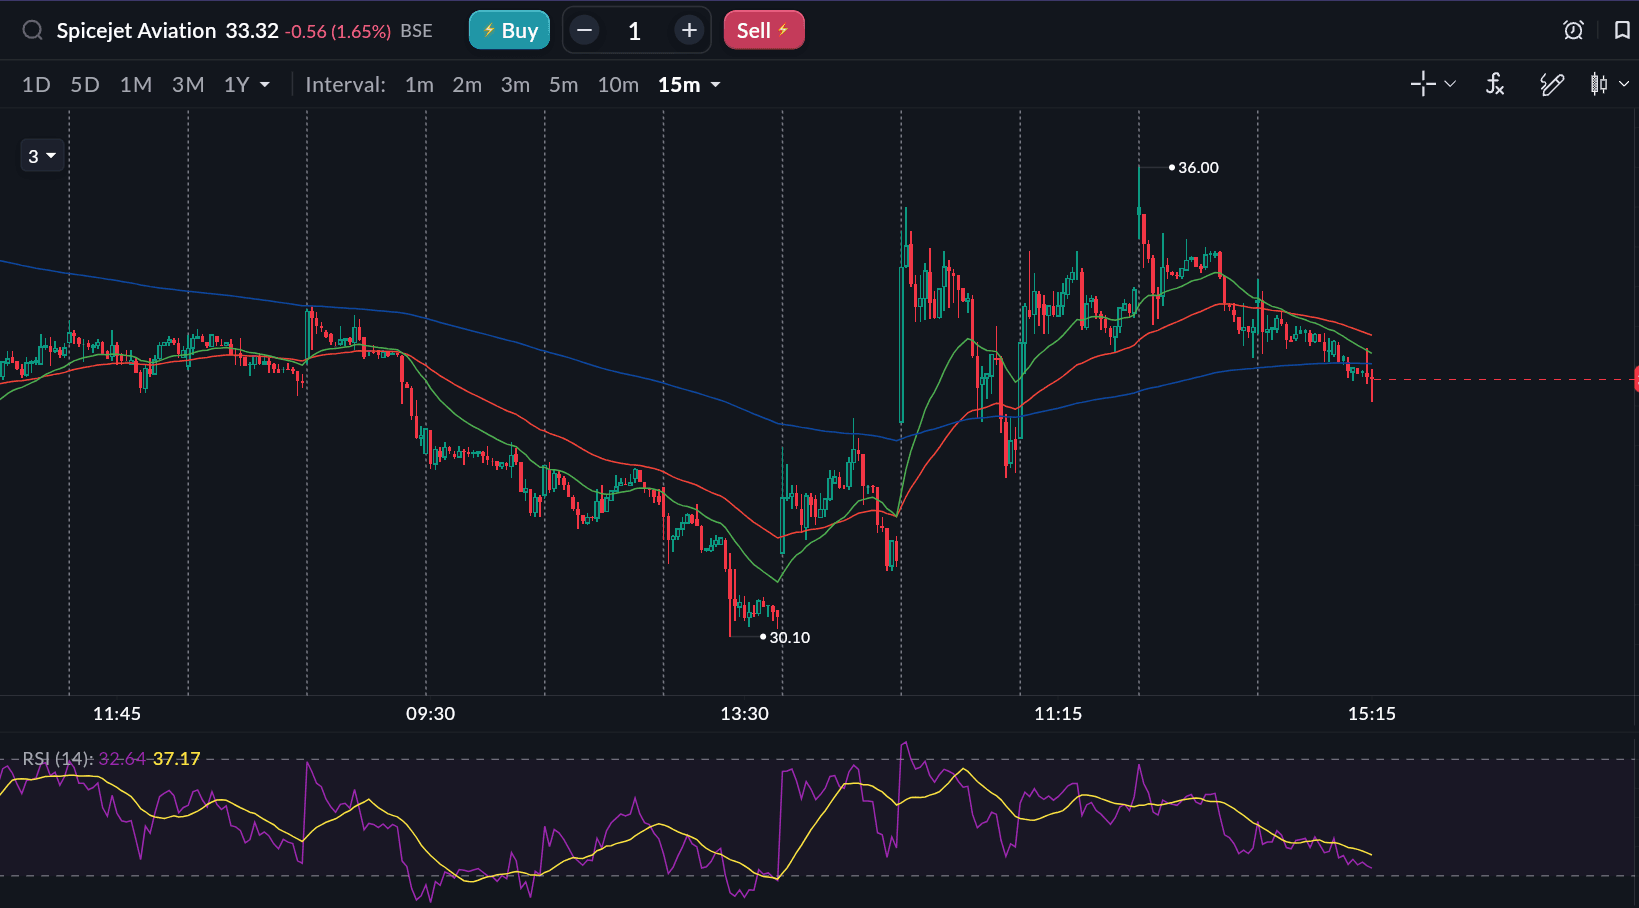
The ₹30–33 Zone: Stabilisation or Just a Pause?
The stock is currently hovering in this region, which has acted as a temporary base. But the signals remain cautious:
- No strong volume-backed reversal
- No sustained close above short-term EMAs
- Price action still not forming a decisive trend-building structure
For SpiceJet, the path to recovery begins only when the stock can:
- Break above the shorter EMAs
- Hold those levels
- And attract follow-through buying
In fact, the first signs of real stability may only emerge if the stock manages to close above the ₹38 zone on the weekly chart a level that would mark early structural improvement.
Until then, the downtrend remains the dominant narrative.
What Traders Should Really Be Watching
As the IndiGo incident fades from the top of news feeds, the market will go back to doing what it always does pricing in the truth quietly, without the drama.
And the truth right now looks like this:
- IndiGo is being tested, not broken.
- SpiceJet is still searching for stability.
The ₹4,700 level on IndiGo’s chart will be a key reference point in the coming days, while for SpiceJet, reclaiming weekly EMAs remains the hurdle that must be crossed before any meaningful recovery can begin.
Different airlines, different trends, different investor expectations.
But one shared reality:
Aviation stocks may fly the same sky, but they rarely follow the same trajectory.
Related
Recent
SEBI Regulation Margin Benefit Calendar: Expiry-Day Change for Single-Stock Spreads
RBI MPC February 2026: Repo Rate Held at 5.25% as RBI Prioritises Stability Over Fresh Easing
Indian Oil Q3 FY26 Results: Strong Earnings Momentum Driven by Refining Upswing and Government Support
Nykaa Q3 FY26 Results: Net Profit Surges 143% YoY to ₹63.3 Crore; Revenue Grows 26.7% to ₹2,873 Crore
PVR INOX Q3 FY26 Results: Reports Net Profit of ₹96 Crore; Revenue Jumps 9.7% YoY to ₹1,908 Crore