
From Exchange to Eyeballs: Engineering Sahi's Ultra Low Latency Feed & Chart
You're watching Nifty spike on budget day. Your finger hovers over the buy button. But the chart hasn't caught up—it's still showing prices from two seconds ago. By the time it updates, the moment has passed.
This is the reality for users on most trading apps. Not because the data doesn't exist, but because the path from exchange to screen was never designed for speed. It was assembled from off-the-shelf parts: a third-party charting library, a generic WebSocket gateway, a database that works well enough. Each component adds latency. Each abstraction adds delay. And when markets move fast, "well enough" isn't.
At Sahi, we decided early that this wasn't acceptable. We wanted charts that update the instant prices move. Not approximately instant. Actually instant. That meant building everything ourselves—the data pipeline, the distribution infrastructure, the charts. Every layer, purpose-built for one thing: getting market data to your eyes as fast as possible.
This is the story of how we did it.
The Pipeline
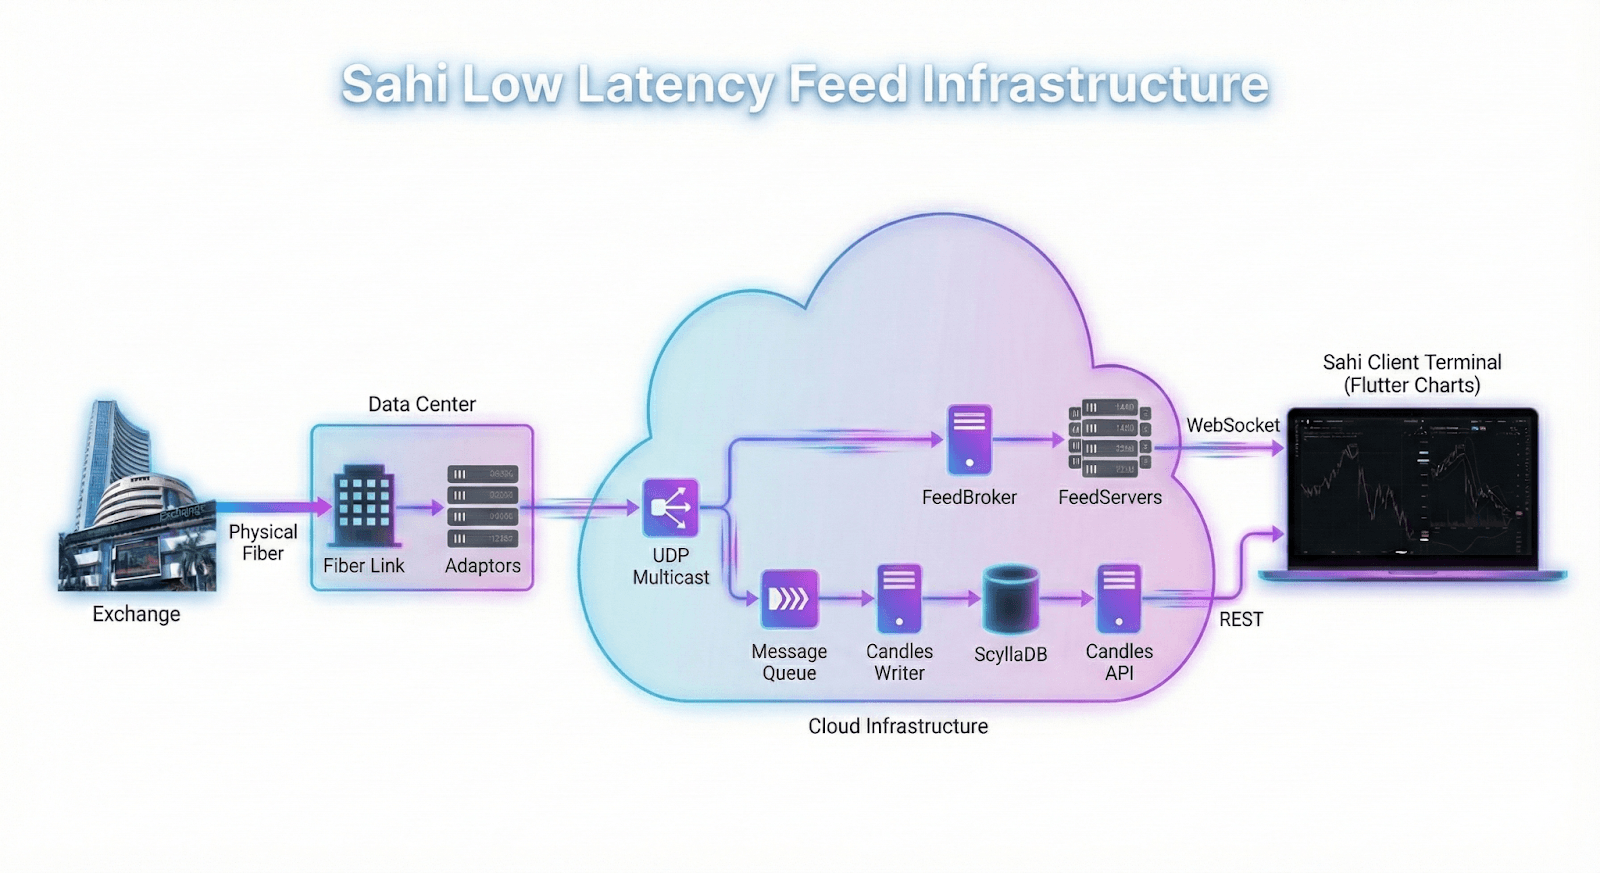
Market data arrives via dedicated fiber from the exchange to our data center. Our Adaptors sit at the end of this link, receiving raw ticks via UDP multicast. Exchanges speak different protocols, use different formats. The Adaptors' job is to translate—every tick that leaves them looks identical regardless of whether it came from NSE or BSE. This normalization happens once, at the edge, so nothing downstream wastes cycles figuring out what format it's looking at.
From the Adaptors, data moves to our cloud infrastructure and is immediately rebroadcast via UDP multicast. This is where the pipeline forks.
Real-time ticks take the fast path: Feedbroker picks them up directly from multicast, maintains a cache of the latest price for every instrument, and fans out to our FeedServers—the Rust WebSocket servers that maintain connections to clients.
Historical candles take the durable path: ticks flow through a message queue to Candles Writer, which aggregates them into 5-second, 1-minute, and 1-hour candles before writing to ScyllaDB. The Candles API serves this historical data to clients.
Both paths converge at our Sahi Charts—native, custom-built using Flutter, speaking directly to our infrastructure with no translation layers in between.
That's the architecture. But architecture diagrams are clean. Reality isn't.
The Candles Problem
Our first version of the candles system worked. Technically. We stored candles in ScyllaDB with a straightforward schema—one partition per instrument and candle interval, ordered by timestamp. Simple, intuitive, wrong.
The problem revealed itself gradually. As data accumulated, partitions grew. Some instruments—Nifty, Bank Nifty, Reliance—had large amounts of candles in single partitions. Queries that should have been fast started crawling. p9999 latency crept up to 300 milliseconds. For a charting system, that's an eternity.
ScyllaDB is fast, but it's not magic. When a partition grows too large, the database has to scan more data, manage more memory, coordinate more internally. We were fighting the architecture instead of working with it.
The fix was time-bucketed partitioning. Instead of one partition per instrument forever, we partition by instrument and time window. Bucket sizes are tuned per candle interval based on query patterns—a 1-minute candle table uses different boundaries than a 1-hour table. The goal: hit as few partitions as possible for a typical query, while keeping each partition small enough to stay fast.
We also leaned hard into client-side optimisations: Scatter-gather queries, Use ScyllaDB's shard-aware and token-aware routing, DC and region-aware routing, tune consistency levels for reads and writes, etc. With token-aware routing which is unique to ScyllaDB, the Rust driver knows exactly which node and which CPU core owns each partition. Queries go directly there—no coordinator node, no extra hops, no wasted work.
After the redesign: p9999 dropped from 300ms to under 25ms. p999 sits under 20ms. p99 is around 10ms for fetching 1,000 candles. That means out of 10000 users, 9999 users get the chart loaded in under 20ms – That’s instant. Users scrolling through months of price history experience it as instant.
Think we're exaggerating? Open Sahi and scroll through a year of any stock's candles. We'll wait.
The Real-Time Problem
Candles are the easy part—you have time to batch, aggregate, optimize. Real-time is different. A tick arrives, and it needs to reach every subscribed client now.
Our first implementation was straightforward: single-threaded fan-out. Tick comes in, loop through subscribers, send to each. It worked fine in testing. Then we launched.
On a normal trading day, instruments like Nifty 50 have tens of thousands of subscribers. Single-threaded fan-out meant each tick waited in line while the previous one was distributed. We started seeing p9999 latencies of 10 milliseconds for a single tick to reach all subscribers. Ten milliseconds sounds small until you remember that ticks arrive continuously, and delays compound.
The fix was sharded fan-out. Instead of one thread owning all subscribers, we partition clients across shards. Each shard owns a subset of connections and processes ticks independently. A tick for Nifty now fans out in parallel across shards instead of sequentially through one bottleneck.
But sharding was just the foundation. The real engineering is in what happens within each shard.
FeedServers are written in Rust—not for fashion, but for predictability. No garbage collector means no GC pauses. The strict compiler of Rust with its borrow checker and powerful type system make it easy for us to optimize the system as needed without worrying about causing catastrophic memory related bugs.
The feedservers are entirely lock-free: channels for communication, an actor model for isolation. Each client connection is managed by a dedicated actor that owns its state exclusively. No mutexes, no contention.
We use copy-on-write patterns throughout. When the same Reliance tick goes to thousands of subscribers, we're not copying bytes for each one. Data is shared by reference until something actually needs to modify it.
For serialization, we avoid the obvious approach of collecting each client's subscribed instruments, building a message, and serializing per-client. That's redundant work when thousands of clients care about the same stocks.
Instead, when a tick arrives, we pre-serialize it into different field subsets based on subscription modes—LTP-only, LTP with quote data, full depth. These serialized chunks are cached as immutable memory (Using an Arc if you're a Rustacean). When flushing to a client, we clone references to the relevant pre-serialized sections and repack them into the outgoing message. No re-serialization, no redundant encoding—just memory references and byte copying.
On the wire, we disable Nagle's algorithm, tune socket buffers, and reduce SYN timeouts. Small gains that compound across millions of messages.
Another optimization is adaptive batching. The naive approach sends ticks one-by-one: read from queue, send, await I/O, repeat. But await points yield control to the async runtime, introducing scheduling delays. An alternative is timer-based batching: wait for a batch to fill or a timer to expire, then flush. That optimizes throughput but worsens latency—every tick waits for the timer.
We do neither. When an actor gets scheduled, it drains whatever has accumulated in its queue—no awaits during the drain—batches everything, and flushes in a single write. Fast clients get small, frequent batches. Slow clients automatically get larger batches that catch them up. The system self-tunes based on how quickly each client consumes data, without explicit backpressure negotiation.
But self-tuning isn't enough when a client goes pathologically slow—or dies entirely while holding a connection. This happens: users on flaky mobile networks, someone walking into a parking basement, a phone switching from WiFi to cellular. We run an RTT estimator that sends periodic probes to measure round-trip time. Combined with queue backpressure metrics, this lets us detect clients that are falling too far behind or have gone silent. Those connections get force-disconnected before they can degrade performance for everyone else. The system stays healthy even when individual clients don't.
With all these optimizations in place, our p9999 dropped from 10ms to under 2ms. A single Nifty update hits our server and gets dispatched over the network to be sent to thousands of clients within 2ms.
FeedServers handle serious volume. On a typical trading day: 8 billion ticks. 600,000 messages sent out every second, sustained across the entire 6-hour-15-minute session. Over 600GB of data pushed to clients before the closing bell. Every single trading day.
The infrastructure behind this? Three small servers. Two physical cores each (4vCPU). 8GB of RAM. Cruising at 20% CPU (i.e., 80% to spare) and only 2.5GB of memory usage.
Talk about efficiency.
The Charts
All of this infrastructure—the fiber, the Adaptors, the multicast, Feedbroker, FeedServers, ScyllaDB, the Candles API—exists to serve one thing: the charts you actually see.
Most trading apps take a shortcut here. They embed a third-party charting library in a WebView. It's faster to ship, and the libraries are mature. But you inherit the WebView's overhead: separate process, JavaScript runtime, bridge latency for every gesture. Your chart is a guest in your own app.
We built our charting engine from scratch in Flutter. Custom canvas rendering. Custom gesture handling. Custom interaction model. The same codebase runs on our mobile apps and web trading terminal.
This isn't just about control—it's about integration depth. Our charts speak directly to the Candles API for history and FeedServers for real-time updates. No adapter layers translating between formats. No generic data bindings that don't understand our access patterns. When a tick arrives via WebSocket, it updates the chart. That's it. No ceremony.
This tight integration enables features that would be awkward bolted onto a generic library: executing trades directly from the chart, visualizing open positions as overlays, rendering orders at their price levels. These aren't plugins negotiating with someone else's API. They're native to the same rendering pipeline that draws the candles.
The result is charts that feel like they belong to the app because they do. Pinch-to-zoom is fluid. Panning is responsive. Real-time candles update without perceptible delay.
Don't take our word for it—install Sahi and stress-test the charts during market open. Pinch, zoom, scroll, switch timeframes. See if you can make it stutter.
Why This Matters
We could have embedded an off-the-shelf charting library. Used a managed time-series database. Built on a generic WebSocket gateway. Shipped faster.
But infrastructure decisions compound. The abstractions you adopt become the constraints you live with. The latency you accept at launch becomes your baseline.
Every component in this pipeline exists because we asked: what's the fastest way to get this data from the exchange to a trader's eyes? Sometimes that meant writing Rust. Sometimes that meant rebuilding charts from scratch. Sometimes it meant choosing a database architecture over a managed service.
This is what tech-first means at Sahi. Not that we use technology—every broker does. That we build it, end-to-end, for the specific problem of helping people trade.
When markets move, your charts should keep up. At Sahi, they do.