Candlestick Patterns - Tweezer Top

The tweezer top is an important candlestick pattern for technical analysis in stock trading. It displays the fact that after a rise, a trend may change, thus indicating a downward move. This is how finding tweezer tops guides us to get more structured plans for trade and wise choices in bigger market changes. Let's delve into why this pattern is significant and how it helps in financial markets.
Understanding Candlestick Patterns
Candlestick patterns are critical in technical analysis. They help us understand how the market feels and predict price changes. Every candlestick shows four major prices: open, close, high, and low, providing much information regarding market trend at a particular time.
The tweezer top and tweezer bottom are also highly relevant. The tweezer top suggests a sign of going down, probably in altering the trend direction after rising. And then, there is the tweezer bottom signaling going up, that may change after falling. That kind of discovery in trends and patterns could significantly help our trading plans, even when making it in the ever-changing markets of India.
Knowing these patterns helps us make better decisions. The tweezer top occurs when two candles almost meet at the high, which shows that prices have a limit to going up. The tweezer bottom occurs when two candles almost meet at the low, showing that prices have support. Knowing these signs helps us respond quickly in fast markets.
What's essential is we need to be careful when we see these reversal signs. We need to check them with other technical tools to ensure our trades are strong. Therefore, by learning candlestick patterns, we improve our trading skills to aim for more wins.
What is a Tweezer Top?
The tweezer top is important in technical analysis because it shows a bearish reversal. It matters for our trading plans, which focus on candlestick and chart patterns.
Definition and Character
A tweezer top has two candlesticks that are nearly the same height. This indicates market resistance. The first candlestick is bullish, which means it shows an upward trend. The second is bearish, meaning it closed lower but reached the same height as the first.
It is a kind of war between the buyer and seller, and it indicates a reversal or change to a downward trend.
Creating the Tweezer Top Pattern
The tweezer top pattern occurs due to some actions of the market. There first appears the upwards trend with the strong candlestick. Then, at the following day, the weaker candlestick arrives that has almost the same high.
This two-day pattern shows us how the market is working. It indicates buyers pushing the prices up while sellers are just beginning to get effect. Seeing the tweezer top on charts warns us ahead of price changes. It helps us prepare plans for trades.
How to Identify a Tweezer Top
Finding the top pattern of a tweezer requires close attention. We must first see if it is met under the conditions that will make it act as a sign for the reversal of a bearish nature.
Conditions of Formation
For a tweezer top to be valid, it must meet some critical requirements:
An upward trend has to be there before it takes shape.
The first one should be an up, with good buying.
The second candlestick should go downwards and nearly touch the high of the initial candlestick.
Using tools like the Relative Strength Index (RSI) and Moving Averages can make this pattern more trustworthy. They help us confirm the reversal signal. Also, watching the volume during this time can show us if there is buying or selling pressure. This helps us choose our next steps.
See Information on Charts
The tweezer top pattern is simple to identify on charts with Japanese candlesticks. We notice two candlesticks which have posted a similar or identical high. But one has indicated tremendous buying activity while the other has shown a shift in selling. This indicates that sellers are slowly taking control. The tweezer top on charts gives us an opportunity to respond rapidly to changes in the market. The close highs aid in controlling positions and making good trading decisions.
Importance of Tweezer Top in Technical Analysis
The tweezer top is a pattern that is very significant in our technical analyses. It indicates the change of a trend. A tweezer top means that the sellers start taking control when one sees it after an increase. This pattern consists of two candlesticks with nearly the same high; this means that the buying pressure is weakening.
In Forex, bullish and bearish tweezer tops can help show when trends might change. Traders combine these with other tools to be more confident. Tweezer tops and engulfing patterns provide us with important hints. New traders, however, misunderstand them or depend on them too much.
In the quickly changing world of cryptocurrencies, it is important to watch tweezer tops closely. False signals can occur, so we should be cautious. Our Forex strategies need to be flexible, taking into account how different currencies and economic factors change.
| Attribute | Significance |
|---|---|
| Trend Reversal Indicator | Shows possible chances to sell after an increase. |
| Market Sentiment | Reflects a change from buying to selling pressure. |
| Pattern Forming | Has two candles with almost the same highs. |
| Common Market Use | Works well in foreign exchange, stocks, and digital currencies. |
| Risk Management | Helps establish the stop-loss and take-profit levels. |
Tweezer tops play a very important role in our trading plans. They are great to see and useful in many markets. They help us make good trades when trends may be ready to flip.
Tweezer Top in Stock Trading
Probably, an individual needs to learn about the tweezer top pattern in stock trading. This will always show us the best times for buying and selling. When the price of a stock has reached its highest point, a change in market feelings often occurs.
Using Tweezer Tops for Buying and Selling Signals
A tweezer top is a change from good to bad feelings in the market. It occurs when the first candle is up, followed by another candle which goes down but is approximately at the same high. The trader needs to know
The tweezer top shows that the rise is weakening. Perhaps now is when to sell: it reflects a trend of change. Investors may start shorting and/or liquidate the long positions.
For instance, if a tweezer top comes out at Rs 150, it may indicate a bottom. He thus learns to cut down risks and trade further.
| Pattern | Price Movement | Stock Trading Effects |
|---|---|---|
| Tweezer Top | Forms at the end of an upward trend | Indicates possible sell signals; makes us rethink long positions |
| Tweezer Bottom | Bottom of a downtrend | Interprets the buy signal opportunity; might be a signal for the bullish reversal |
That is to say, the tweezer top is an important signal showing balance between buyers and sellers and will assist in making the right trading decisions.
Price Action and the Tweezer Top
Understanding the price movement of the tweezer top pattern is important. It shows a change in how people feel about the market when sellers begin to lower prices. The strong rise meets a barrier, and the second candlestick that matches the first's high suggests a possible end to the upward trend. At first, the market moves quickly because buyers are excited. But when the second candlestick closes lower, sellers show their power. This change in how people feel about the market suggests that a drop might be coming.
"Price action gives us clues about how the market behaves, helping us plan as we deal with potential changes in momentum."
Traders should find important support and resistance levels near the tweezer top. Knowing these levels helps in making better plans for when to enter and exit. Using technical indicators can also help confirm changes in the trend that the tweezer top suggests.
| Aspect | Details |
|---|---|
| Formation Context | Usually takes place at the end of an uptrend |
| Shift in Sentiment | Move from Bullish to Bearish |
| Market Behavior Prior | Strong bull trend now weakening |
| Major Indicators | Resistance levels and more technical confirmation |
| Trade Consideration | Monitoring price movement for confirmation before a trade. |
Applying Trade Strategies with the Tweezer Top Pattern
It is important to know how to trade using the tweezer top pattern. We have to learn at least the entry and exit points. Also, we must set stop losses to adjust the risk.
Entry and Exit Points
We then need to define the entry and the exit points as follows when applying the tweezer top to the trading chart. We enter a trade when we spot a bearish candle following the tweezer top. This occurs when the price falls below the high of the last bullish candle.
Our exit points depend on the market. They often line up with past resistance levels. This helps us create our trading plan.
Setting Stop Losses
We have our stop losses set into our plan. For the short trades, we placed a stop loss above the high of tweezer tops. That keeps us safe from sudden market changes.
By deploying smart stop loss strategies, we are able to reduce losses and also aim for gain when the markets are in their favor.
| Aspect | Details |
|---|---|
| Entry Points | Confirmation of a bearish candle below the low of the preceding bullish candle |
| Exit Points | Determined by market conditions, aligning with previous resistance levels |
| The Stop Loss | Goes at the highs above the tweezer top pattern |
| Risk Management | Focus on minimizing possible losses while aiming for more profitable trades |
Comparison of Tweezer Top and Tweezer Bottom Patterns
It's good to know the difference between a tweezer top and a tweezer bottom for trading. Tweezer top shows a shift from a good market to a bad one. It happens in a condition where two candles have nearly the same high following the price increase. Usually, the first candle is strong, followed by a weak one that reaches the high of the day before, indicating the change in trend.
The tweezer bottom changes from going down to going up. This happens in two candles that have nearly the same low after going down. It is characterized by the first candle that goes down then a candle that goes up matches the low of the previous day. This pattern expresses that the price would go up after experiencing a drop.
Let's look at these two patterns now:
| Feature | Tweezer Top | Tweezer Bottom |
|---|---|---|
| Market Sentiment | Shifts From Positive To Negative | From Negative To Positive |
| Candle Structure | Two candles with identical highs | Two candles with identical lows |
| First Candle | Rising | Declining |
| Next Candle | Down | Up |
| Occurrence Rate | Varies according to the market condition | 10-15% in technical analysis |
| Confirmation Indicators | Technical analysis needed for confirmation | Higher highs and increased volumes |
Seeing tweezer candlestick patterns means we have to be careful. A trend change may happen real soon. Both patterns are essential signs of how the market feels. By knowing these, we can change our strategies as the market changes.
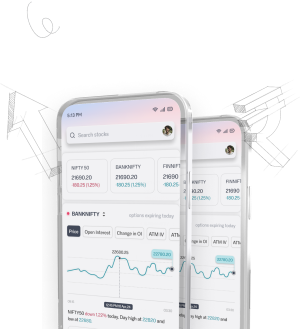
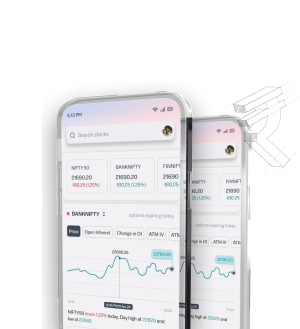
Improving Trading Using Sahi Trading App
The Sahi Trading app holds significant importance in the solutions to today's trading problems. These feature powerful features which make our strategies much better. We can easily purchase options and know about candlestick patterns such as the tweezer top.
This makes our trading decisions more confident. The app's easy-to-use design makes mobile trading smooth. We can quickly respond to market changes.
Sahi Trading is good for traders who like to trade fast. It tracks such important patterns such as tweezer tops in real time, which makes us notice changes in the market in time.
All setup on a single screen lets us watch our trades and control our money easily. This keeps us focused and working well.
In today's fast-moving world, Sahi Trading is the sort of application that makes trading a matter of ease. It keeps us in contact with changing conditions of money. Its simple design enables us to take chances and remain good at trading.
FAQ
What is a tweezer top in candlestick patterns?
The tweezer top is a candle pattern where a bearish reversal could occur after an upward trend. Two identical top high points appear on the line of the pattern-it is usu- ally bull, then bear.
How do we look for a tweezer top pattern?
Look for a rising trend that is followed by a down candlestick near the high of the day before and confirm it using technical indicators.
Why is the tweezer top important in technical analysis?
The tweezers top is important in that it shows that a trend may be changing. It shows selling pressure is building up after prices have risen. This gives us precious information on how the market feels.
What are the conditions necessary to create a tweezer top?
A tweezer top requires at least an uptrend; it also requires a bullish candle followed by a bearish one, the same in height as the former. The more auspicious the pattern is supported by technical indicators, the better.
How do we use the tweezer top in stock trading?
In stock trading, a confirmed tweezer top means it is time to sell. It helps us close long positions or start shorting. It shows when a stock is bought too much, helping us avoid big losses.
What is the role of price action with the tweezers top?
Price action before the tweezer top shows how the market feels. A strong upward trend might show strength. But, if sellers start to appear, it may be the change and thus helps us plan trades better.
How do we know when to enter and exit when trading the tweezer top?
We initiate a trade when the bearish candlestick of the tweezer top is confirmed. That occurs when the price is under the low of the bullish candle. The exit points should coincide with the conditions of the market and even the resistance levels.
Why is it important to set stop losses for trades with the tweezer top?
Setting stop losses is important when trading a tweezer top. We put a stop loss above the high of the tweezer pattern. This helps limit losses and keeps our positions safe while we benefit from market changes.
What is the difference between the tweezer top and tweezer bottom?
The tweezer top is a bearish reversal pattern that shows an indication of a reversal after an uptrend; the tweezer bottom shows a bullish reversal after a downtrend. Both patterns reflect market sentiment but show opposite actions of buyers and sellers.
How can Sahi Trading app be used in a search for tweezer tops?
This Sahi Trading app also allows us to track candlestick patterns, such as tweezer tops. Its user-friendly interface and quick trading tools for buying options empower us to make better trades and make smart choices.
You may also like blogs on
Disclaimer
The content provided is for educational purposes only and does not constitute financial advice. For full details, refer to the disclaimer document.
desktop.
Trade on the go with Sahi
Mobile App