Elliott Wave Theory: Ralph Nelson Elliott's technique for understanding market cycles through patterns.

Ralph Nelson Elliott created the Elliott Wave Theory in the 1930s. He researched 75 years of financial data. He found that markets move in predictive patterns—just like fractals.
Elliott researched the thoughts humans pass through the market, indicating that these feelings wave the prices. In this article, we will explain Elliott's ideas and how they are used today. We will look at how his theory helps traders and analysts all over the world.
Main Points
- Ralph Nelson Elliott studied 75 years of data to make the Elliott Wave Theory.
- The theory divides market movements into two parts: impulse waves and corrective waves.
- Elliott correctly anticipated the low of the stock market in 1935, thus proving his theory.
- Fibonacci ratios help in understanding wave relationships and price changes.
- The Elliott Wave Principle gained the most popularity during the '70s and '80s due to some key figures.
- Today, artificial intelligence-based tools like EWAVES help in Elliott wave research.
Introduction to Elliott Wave Theory
Elliott Wave Theory helps us understand financial markets. It was created by Ralph Nelson Elliott in the 1930s and describes how price alterations are related to market sentiment and human activities.
This theory divides market trends into two types: impulsive waves and corrective waves. Impulsive waves move the market up in five steps. Corrective waves bring the market down in three steps. This helps traders understand what is happening in the market.
Elliott's theory is an emotional one. Waves show the progression in which sentiment changes from low to high. Fractal patterns help to clarify how large and small waves relate to each other. Put another way, large overall trends can once again be repeated in miniature form.
Elliott also related his theory to the Fibonacci sequence. This is a math series developed by Leonardo Fibonacci. It helps us set goals and guess price changes using numbers like the golden ratio of 1.618.
The Elliott Wave Theory gives us insight into markets and therefore is the order and directional impetus in the often confusing world of trading.
History Background of Ralph Nelson Elliott.
Ralph Nelson Elliott was born in Marysville, Kansas, on July 28, 1871. He is currently famous for the Elliott Wave Theory. In the early 1930s, he examined seventy-five years' data covering stock market performance.
The study helped him see how the market changes and what to expect. His work resulted in the development of Elliott Wave Theory.
Elliot noticed patterns in market movements. He used a mathematical angle of how the traders think keeping him ahead. In 1935, he predicted a fall in the stock, which proved his credibility in studying these trends.
In August 1938, Elliott and Charles J. Collins published a book called "The Wave Principle." This book helped traders and analysts understand his ideas. It explained how market trends follow wave patterns that come from human emotions and decisions.
Elliott found that market trends have five strong waves and three adjusting waves. This was a most vital part of his theory.
His last major work was published in June 1946, entitled "Nature's Law – The Secret of the Universe," which further developed his earlier ideas. His theories were taken forward by people like Glenn Neely in 1988 and Robert Prechter in 1978.
Work that Elliott has done has been very important in market analysis. His thoughts remain important to this day.
Mastering Market Psychology and Fractal Patterns
In the Elliott Wave Theory, market psychology plays a critical role. It helps us understand the trends in the stock market by observing how investors behave together. The feelings of investors impact their trading decisions and market trends to a great extent.
The theory explains different waves based on how people feel about the market. These waves show how feelings and actions of investors do affect the market. With Elliott Wave Theory, all we see is how feelings create patterns, which repeat themselves.
Fractal patterns are the repeating math shapes in different sizes that are important for the market view. They let schemes show us how prices change because of human feelings on different levels. Big waves show the general market feelings; small waves show fast emotional reactions. That is the way investor behavior is connected in time.
The understanding of market psychology and fractal patterns helps us understand price trends more clearly in regard to the Elliott Wave Theory. This knowledge therefore improves our analysis and trading strategies by aligning our trading in accordance with the emotions of the market.
| Aspect | Market Psychology | Fractal Patterns |
|---|---|---|
| Definition | The emotional and psychological factors that influence investor decisions. | Mathematical constructs that display self-similarity over scales of length. |
| Role in Elliott Wave Theory | Structures the development of waves driven by mass psychology. | Depicts periodical price movements, showing investors' psychology. |
| Impact on Price Trends | Affects market movements due to emotional reactions. | Illustrates that big trends follow small trends in investor behavior. |
| Usual Application | Deciphering investor sentiment at market peaks and troughs. | Analyzing price movements through repetitive structures. |
Impulse Waves and Corrective Waves
It would be nice to note the difference between impulse and corrective waves of Elliott Wave Theory. These types depict different price movements in market trends. They help us understand wave patterns.
Features of Impulse Waves
Impulse waves are large movements that follow the market trend. They have five parts: 1, 2, 3, 4, and 5. Waves 1, 3, and 5 support the trend. Waves 2 and 4 pull back for a short time. Key characteristics include:
- Impulse waves follow a 5-3-5-3-.
- Wave 3 is relatively longer, enabling the power of the wave.
- The trend is very strong, with steep angles.
- These waves frequently reach Fibonacci levels including 38.2% and 61.8%.
Impulse waves can last from hours to months, showing big volume and speed. They try to help traders understand the moves in a market.
Corrective Waves: Understanding
Corrective waves go against the main trend. They have three parts: a, b, and c. These waves create pauses in market trends. Important things to know about corrective waves are:
- They are slow and more permanent, compared with impulse waves.
- They are less regular than impulse waves.
- The market can move horizontally, consolidating at these stages.
These waves show us changes in the market. They help us see the overall picture of wave patterns and trends. Understanding how impulse and corrective waves work helps us grasp market ups and downs better.
Elliott Wave Theory: Major Concepts
Some of the important concepts that the Elliott Wave Theory presents, which help in perceiving the market trends, are that markets move in a pattern of eight waves. This includes five waves trending in one direction and three waves trending in the opposite direction.
Each wave pattern shows the market's fractal nature. This means we see similar patterns at different time scales. This helps us predict market moves.
Impulsive waves, such as waves 1, 3, and 5, follow the main trend. Waves 2 and 4 reverse the trend. Recognizing the difference helps us develop a better plan of trading.
Markets usually show three-wave trends more than five-wave patterns. This information helps us understand how the market moves. The Fibonacci series also provides numbers to find important market levels.
Applying principles of Elliott Wave helps us to identify the market patterns, which afford us an edge in complicated markets.
Relation of Fibonacci Ratios in Elliott Wave Theory
Fibonacci ratios are very important in Elliott Wave Theory analysis. They identify critical points of market cycles. This tells us what could be the next move and when a market correction could be expected. Elliott discovered that waves often correct to these key ratios: 38%, 50%, and 61.8%. These ratios really offer some great views on the way the market is moving and advance our trading strategies to a new level.
The Fibonacci sequence begins with 0 and 1. Then it adds the last two numbers to find the next one. Ratios such as 0.382, 0.618, and 1.618 are important for us. They indicate where price changes might end, suggesting possible shifts in the market.
It helps to use Fibonacci analysis on the Elliott Wave to predict the market better. We can estimate how deep will corrections go by looking where prices stop. The understanding that corrective waves usually return to the Fibonacci levels helps us to make good decisions.
| Fibonacci Ratio | Retracement Level | Typical Use in Elliott Wave Theory |
|---|---|---|
| 0.236 | Low | Early correction measurements |
| 0.382 | Standard reversal sign | Improvement in corrective factors |
| 0.500 | Mid-level retracement | Identifying strong market corrections |
| 0.618 | Golden Ratio | Major point of interest in Elliott Wave Theory |
| 0.786 | Near low | Signifying deep market retracements |
Applying Fibonacci ratios helps us make some correct trading decisions through analyses of the Elliott Waves, thereby improving our method of handling market corrections.
Wave Degrees in Market Study
Understanding wave degrees in Elliott Wave Theory helps in comprehending the market. The theory involves waves of different sizes and complexity, ranging from Grand Super Cycle down to Sub-Minuette. With such inclinations, one can pick out certain price movements against the general outlook.
- Grand Super Cycle: The biggest wave, lasting decades.
- Super Cycle: Shows Years and Major Trends.
- Year: Lasting above one year, indicating market trends.
- Primary: Covers big moves in weeks to months.
- Intermediate: Observes short-term variations, for weeks.
- Minor: Shows small price changes over days.
- Minuette: Watches hourly tendencies and small price changes.
- Sub-Minuette: A further subdivision, with prices changing every few minutes.
Structure of the Elliott Wave helps us understand how changes in the short run connect to the long-term trends. A finished cycle in the Elliott Wave has eight waves, five up and three back down. This shows a pattern in the market movements that sort of looks like a fractal. Wave 3 often goes higher than the price of wave 1, showing a trend.
Knowing trend structure will help to see wave patterns. Wave 4 typically does not retracement into the price area of wave 1, and that helps to let the trend continue. If wave 2 is sharp, then wave 4 will probably be complex. Such details are quite essential for market analysis and predicting trend turn points.
| Wave Degree | Time Frame | Characteristics |
|---|---|---|
| Great Super Cycle | Decades | Biggest price direction changes. |
| Large Cycle | Decades | Large changes and trends. |
| Cycle | Year | Shows big market moves. |
| Primary | Weeks to Months | Talks about major market trends. |
| Intermediate | Weeks | Shows changes in price. |
| Minor | Days | Shows small price changes. |
| Hours | Shows Minutely Tag. | Shows the smallest price changes. |
| Sub-Minuette | Minutes | Shows the smallest price changes. |
The knowledge about wave degrees is important to make a good market analysis. It helps us get the view of the running wave patterns. With help from these degrees, we can make better trading plans based on Elliott Wave Theory.
Applying Elliott Wave Theory in Technical Analysis
Getting to know the Elliott Wave Theory in technical analysis can help our trading plans a great deal. It helps us in identifying crucial patterns important to wave analysis. This gives us crucial insight that will affect our trades. It makes us better at understanding the market and increases our chances of making money.
Wave Analysis in Trading Strategies
Elliott Wave Theory helps us find specific wave patterns and market phases in our trading plans. We focus on two main types of waves: impulse waves and corrective waves. Impulse waves, which have five sub-waves, show strong market movements. Trading during these times can lead to good profits.
Corrective waves consist of three smaller waves, with chances to exit trades after big price changes. To deliver a win, one should understand the market so well, meaning wave analysis will help identify the best moments to buy or sell.
Integrating Other Technical Indicators
Adding more technical indicators can improve our wave analysis and make our trading plans better. Tools like moving averages, Relative Strength Index (RSI), and volume analysis help confirm market trends. Moving averages show the overall trend, while RSI alerts us to overbought or oversold situations.
Many technical indicators make our trading plans better. This helps us deal with complicated market situations more easily.
Weaknesses and Criticisms of the Elliott Wave Theory
For comparison among traders and analysts, the Elliott Wave Theory is famous, but from this theory, objections and problems are pointed out; some people believe the market predictions are unreliable because markets are difficult to predict. The theory can be understood in diverse ways that allow for consistency in its usage.
The Elliott Wave Theory is hard to learn. Most traders find it hard to apply. This can cause confusion in the process of searching for important market patterns.
Another is market noise. It blurs clear patterns and signals. Critics say that the complicated nature of the market does not make anything clear. Still, institutions use the Elliott Wave Theory to help them grasp the market.
The theory gives tips on market trends, but we have to approach it with caution. Trading can also be hazardous when one uses very high leverage. This is where one needs to understand the theory and the risks involved.
| Aspect | Description | Implication |
|---|---|---|
| Human Factor | Different analysts can view wave patterns in different ways | Inconsistency in market prediction |
| Complexity | Wave counting and identification is a difficult task | May apply the theory incorrectly |
| Market Noise | Emerging circumstances disturb evident pattern recognition | Reduces the validity of prediction |
| Risk | Involves significant loss possibility in trading | Demands rugged risk management |
Despite criticisms, the theory is still a fundamental tool for understanding markets. That said, the value it seems to offer, despite its shortcomings and controversy, is some insights.
New Ways to Understand Elliott Wave Theory
Today's trading world needs new views on the Elliott Wave Theory. With technology like algorithmic trading, this theory has changed a lot. Traders need to understand these changes to stay ahead. The old five-wave pattern by Ralph Nelson Elliott isn't always the rule anymore.
Trends can exist in three waves, and this reflects how fast the market changes. This shift can help us understand better the trends in the market. This is through closely monitoring these movements.
Now, within the structure of corrections, it is good to see what is a three-wave build from which traders can clearly come in and out of the market. Considering that on the algorithms, the flexibility in market analysis is required.
"Today's trading world requires a better understanding of market cycles and trends."
Fibonacci ratios help us to do effective use of the Elliott Wave Theory. The Golden Ratio is helpful in getting the support and resistance. This combination of Elliott and Fibonacci gives us better trading strategies.
| Wave Type | Characteristics | Market Behavior |
|---|---|---|
| Impulse Waves | Five labeled waves (1, 2, 3, 4, 5); among these, wave 3 is the most dominant. | Strong price movements indicating overall market trends. |
| Corrective Waves | Three labeled waves (A, B, C), representing consolidation movements. | Periods of retracement, usually containing a mix of different types of structures like zigzags and flats. |
| Zigzag Corrections | Very common three-wave pattern that provides excellent entry/exit opportunities. | Suggests high volatility and reactionary trading behavior. |
The awareness of these new ideas helps us trade better; blending old Elliot Wave Theory with new ways makes us smarter in how we make moves in the markets.
The Popularity of Elliott Wave Theory Today
A lot of traders and financial experts are finding interest in the Elliott wave theory. It is famous and cited for its special trend-following prediction tool, which made it popular among trading groups.
By spotting wave patterns, it helps people see how the market moves. This is especially helpful in today's uncertain financial markets.
Ralph Nelson Elliott designed this theory in the 1930s. It explains eight waves: five going up and three going down. This pattern helps traders see when big price changes could occur, especially in wave 3.
This theory also considers the market over different time periods. With the use of Fibonacci and moving averages, for example, traders can enhance their predictions. This makes the theory helpful for trading strategies.
It's good for noticing when the market might change direction. This helps traders handle risks better. Knowing when the market might go down or switch is important to keep losses low.
Elliott Wave Theory is useful in many financial markets, helping traders in the stock, forex, and commodities markets, and crypto markets. By recognizing patterns in rising and falling markets, one can trade with confidence.
Traders can utilize Elliott Wave Theory with training and education. Some people like it, and some do not, but it clearly affects trading today.
Disclaimer
The content provided is for educational purposes only and does not constitute financial advice. For full details, refer to the disclaimer document.
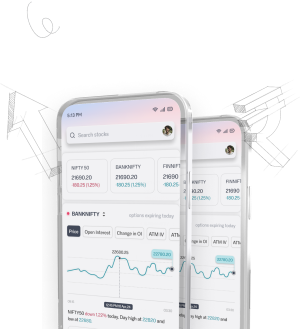
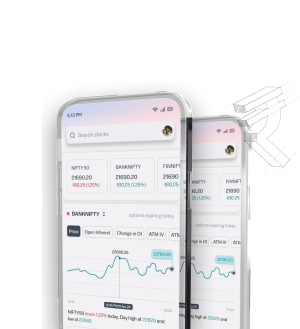
desktop.
Trade on the go with Sahi
Mobile App