Candlestick Patterns - Shooting Star

The shooting star is another significant candlestick pattern in technical analysis. These traders seek it to see whether trends may change their stance in stock trading. It appears after a major rise in the market.
The pattern is small-bodied down at the bottom and long-necked at the top. It's some sort of signal pointing that the market is about to change its course. Here, we will detail the shooting star. We will understand how it provides better trading choices, an aspect that this Indian trader using the Sahi Trading app needed.
This pattern allows us to make better decisions while trading. It can give us even more confidence when working with changes in price.
Understanding Candlestick Patterns
Candlestick patterns are important in stock trading. They show how prices change with opening, closing, highest, and lowest prices. Understanding these patterns is the foundation of technical analysis.
Shooting star is, therefore, very significant. It indicates the market may reverse its direction. Normally, it appears when the price has gone up and signals a fall.
Each candlestick pattern gives us hints for trading. For example, a red shooting star may signal a bigger change than a green one. Recognizing these patterns in the right situation helps us understand the market better. Learning about candlestick patterns helps handle market highs and lows. Thus, understanding these candlesticks leads to better trading decisions and success in the market.
What is a shooting star?
A shooting star is a type of candlestick that appears after a strong rise in price. It suggests a possible change in the trend, making traders reconsider their strategies. Finding a shooting star early helps us better understand how the market is moving.
Definition of a Shooting Star
The shooting star has a small body at the low point of the day and a long shadow above it. That shadow is at least twice as long as the body. This means that buyers raised prices, but sellers took control fast; hence, there is a downward trend.
Features of the Pattern
It follows after a clear upward trend, showing that a strong change is happening.
It has a long upper shadow, showing strong selling after a price jump. The small body at the bottom means that buyers and sellers struggled, which often leads to a drop in price. Generally, it occurs around 50% of the times in trading, making it very usual. It can predict change in prices with an accuracy of about 65 percent in finding it right.
Using the shooting star in our trading plan helps us deal with changes that occur in the market. Having an understanding of this pattern can really improve our trading in several different market situations.
The Body of a Shooting Star
Knowing what a shooting star pattern is would help in good trading. The pattern reveals some significant signs related to changing trends in price. Its parts are clear and give lots of information.
Parts of a Candlestick
A shooting star has a little part at the bottom and a long shadow at the top. This illustrates how buyers and sellers struggle with each other: The small body indicates the price closed near where it started. That means buyers didn't try very hard. The long shadow represents the buyers trying to climb up but failing to. This shows sellers are gaining strength.
It knows that is small with long upper shadow.
The short body and long shadow tell us something important about the market:
After a big rise, a shooting star indicates selling by tired buyers.
This long shadow indicates sellers are in command. This may indicate an enormous trend shift.
This pattern warns us to be cautious. It could be leading to a downtrend. We require more signals for it to confirm.
But only the shooting star pattern is not enough to ensure safety. Using other methods for analysis and risk management is necessary, and this will help manage fluctuations in the market.
| Part | Importance |
|---|---|
| Small Body | Exhibits small price change and potential loss of momentum |
| Long Upper Shadow | Shows that sellers are strong after buyers try to raise prices |
| Context after Uptrend | Means a trend change might be coming as buyers lose power |
Long Upper Shadow shows that sellers are strong after buyers try to raise prices.
Context after Uptrend Means a trend change might be coming as buyers lose power.
Why Shooting Star Matters in Technical Analysis
A shooting star is a significant chart pattern in technical analysis, which indicates the possibility of a trend reversal. Once you identify the pattern, the psychology and behavior of the market become much clearer.
Indicators of Trend Reversal
Typically, a shooting star follows a strong up price movement. It's a sign that the up price movement has already peaked. The CandleScanner found it in a mere 2.7 percent of S&P 500 charts only.
Thomas Bulkowski's study reveals a different face altogether. The trend tends to continue to rise if a shooting star occurs after a big white candle. It is, therefore, a reliable signal to look at our market positions.
Market psychology reflects in the pattern.
It shows that the market's atmosphere is changing. First, many people want to buy, and the prices go up due to the number of buyers. Then sellers gain control and do a directional play. It is the hope-to-doubt flip and could indicate prices are too high. It could mean traders are wrong and a change is due. Watching volume upon seeing the shooting star will confirm if there has been a trend change.
How to Identify a Shooting Star
An appearance of a shooting star may give an indication of how it looks and also its major parts. This pattern appears after a long rise and suggests that it may drop at the upward trend. One needs to pay close attention to these details to understand it correctly.
Context of Genesis After Increase
A shooting star after a strong price advance indicates that buying pressure has decreased. It should thus be searched for following a strong advance, because it might indicate that the trend is ending or reversing.
Things to note about appearance
See a shooting star by receiving an omen from its appearance:
Small body: The body should be small, showing only a small price change during trading.
An important long upper shadow is at least twice the body length. It says that buyers attempted to push prices up but failed to do so.
Very slight lower shadow: It should be a strongly bearish closing mood with almost no lower shadow.
Such patterns help in catching a glimpse of a shooting star, thereby assisting better trading decisions as well.
Trading Strategies Using the Shooting Star
The shooting star pattern will prove to be very effective once it is used in our trading. It is a bearish reversal after an uptrend and hence hints a decrease in price. When to enter, placing stop-loss, and taking profits are all very clear.
Access and Egress Points
First, we short sell when the price falls below the low of a shooting star. The shot works for us in making a profit on account of the downtrend, which is actually expected. To exit, support levels might be targeted. A risk-reward ratio for profit increase and cut loss is also something to consider.
Stop-Loss and Profit Target Settings
Setting the right stop-loss is key. A stop-loss just above the shooting star's high helps manage risk and protect our money. We can also use moving averages or RSI to guide our decisions. Keeping a trading journal helps us see what works and improve our strategies.
Import of Volume in Verifying a Shooting Star
Understanding trading volume is important to using the shooting star pattern effectively. It's not just a shape; it also deals with volume, which actually helps determine if it is a useful tool in the market.
Examining High Volume and Low Volume
A shooting star in a high volume is a strong sign. It's an indication that lots of people traded when the rally did not succeed. It shows a tremendous change in market mood from up to down. But a shooting star, for instance, with low volume is probably not very reliable. It may indicate that the market change is not that sensitive.
Effect of Trading Volume on Credibility
Trading volume and the shooting star pattern help traders. High volume makes the pattern more significant. It indicates that a trend change is more likely, such as after several days of going up.
Low volume calls for caution. It may not really indicate a significant change in the market mood.
| Volume Level | Shooting Star Characteristics | Potential Outcome |
|---|---|---|
| High Volume | Robust trading during the session | Increased likelihood of bearish reversal |
| Low Volume | Minimum trading activity | Weaker reversal signal; risk of false signals higher |
We would have to include volume and the shooting star in our trading plans to make it better. Altogether, this will make better decisions and trading results.
Observing the Shooting Star along with other Candlestick Patterns
The inverted hammer is the biggest candlestick-pattern comparison with the shooting star. These two patterns reflect how crucial it is to learn about such patterns of the candlesticks in trading.
Differences of Shooting Star and Inverted Hammer
The shooting star and inverted hammer are strong signals, but they show different feelings in the market. For example, the shooting star shows when there is a big price increase, indicating a bearish turn.
An inverted hammer occurs in the downward phase, indicating that prices may rise. Such trading needs to be understood if one has to earn money.
Similarity with Other Reversal Patterns
The shooting star looks very much like the other reversal patterns. Even the evening star and the bearish engulfing show similarities with it. Their knowledge helps us in making better trading strategies.
It equips us for changes in the market. The information imparted enables us to take good decisions while trading.
Benefits from Trading with Shooting Star
A shooting star candlestick pattern is useful for traders in that it signals a reversal of a downward motion after the prices have risen. Such changes help us determine when prices may change.
You will find it easy to spot a shooting star because it has a long upper shadow and has a small body. This makes it helpful for traders of all levels. It is also useful at important points like pivot levels and Fibonacci areas.
We can use the shooting star for making a lot of money. We can target a profit at 1.5 times what we risk losing. It's smart to only risk 2% of each trade.
Adding the shooting star to technical indicators improves our success rate. Studies show that it works about 60 percent of the time. It is, therefore, an important tool in our trading tools.
Restriction of the Shooting Star Pattern
The shooting star pattern may provide us with valuable trading signals. But this is not perfect. Knowing its weaknesses helps us make better trading choices. It improves our trading psychology.
Wrong Signals and Risk Factors
The shooting star pattern tends to give wrong signals in unpredictable markets. This might lead the traders to falsely believe prices will fall, when instead they tend to shoot up. So it is necessary to check these signals before we actually act.
This pattern does not tell us exactly when to buy or sell. We need to use other tools and strategies to help us. It is also important to manage risks properly. Setting stop-loss orders above the high of the shooting star can help protect us from large losses.
The strength of the shooting star as a signal to change direction would depend on the trading volume. A strong change needs high trading volume. Low volume suggests the change might not be strong. This shows how important it is to consider the situation in trading.
Knowing well what the shooting star means in different situations, we must do well. In a nutshell, the shooting star is helpful but knowing its limits helps us handle risks better. And this makes our trading strategy stronger.
Real-Life Examples of Shooting Star in Stock Trading
Learning from real-life examples of the shooting star in stock trading is important. It helps us understand and use this pattern more effectively. Seeing how it operates in well-known stocks makes the theory more relatable.
When we look at stock charts, we see shooting stars at important spots. When prices rise quickly, the candle sticks show a shooting star as well, which hints at a possible change of trend. We proceed to check the next candle stick for further proof.
Let's take an example with the stock of a big car company. After a long move up, a shooting star appeared. Body was small, the upper shadow is long and the lower one is small. There were several attempts by the buyers to push the price higher, but sellers then dragged the price down, indicating a change of trend from up to down.
As can be seen in the second figure, a large tech had an exaggerated trend before hitting a shooting star at a top. The pattern, which involved much trading, made traders think twice. And the next trend was down, therefore proving the shooting star correct.
| Shares | Date | Pattern Observed | Market Reaction | Volume Level |
|---|---|---|---|---|
| Top Car Maker | March 2023 | Moving Upward | Price dropped by 15% the following week | High Sales |
| Big Tech Firm | June 2023 | Downbeat Squadron | Began falling | Increased trading activity |
| Pharmaceutical Company | August 2023 | Shooting Star | Sign of decrease followed | Moderate Volume |
The volume is so significant in these examples. In the pattern when the sellers are in control, it warns of a change about to happen. It makes us make better trading decisions because it reveals the fight between the buyers and sellers.
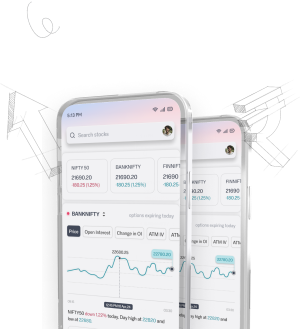
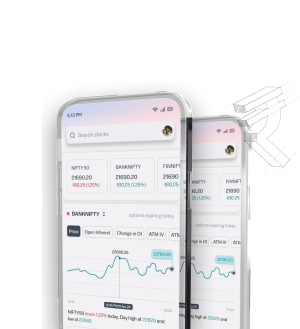
Using Sahi Trading App to Buy Options Conveniently
Sahi Trading app is one of the most important apps for fast option buying and trading on the go. The rating is as high as 4.8/5 based on more than 142,000 reviews, which shows many users like it. The simple design makes it easy to navigate through the application without getting lost—thanks to simple choices, trading can be made easy for both new and experienced traders.
There were some hitches, like the app not opening at times, and missing features like 'Tax Implications'. Of late, updates seem to have ironed out those issues. Now, we can easily cancel e-NACH mandates and create separate folios for different tax statuses. These updates, with problem fixes and user interface improvements, make the app better for quick buying options. They help us navigate the market with confidence.
The Sahi Trading app also proved useful for technical analysis. It provided the opportunity to use and consider various candlestick patterns in making smart trades. By keeping up with market changes, we were assured of better trading success.
Q&A
What does a shooting star mean in candlestick patterns?
A shooting star is a bearish pattern in candlesticks. It normally indicates a possible reversal of the trend upwards. This candle has a very short body at the bottom but a long shadow on top.
How can I recognize a shooting star?
The candle has a very small body and a very long upper shadow. The shadow is at least two times the size of the body. It has little or no lower shadow. The pattern usually follows a long uptrend.
Why is the volume important while shooting stars?
Volume is essential to confirm a shooting star pattern. High volume means more people are trading, making the reversal signal stronger. Low volume makes the signal weaker.
What are the trading strategies with a shooting star?
You can short sell when the price goes lower than the low of a shooting star. Set your stop-loss orders above its high. Use nearby support levels or risk/reward ratio for profit targets.
Can someone depend entirely on a shooting star pattern?
No, a shooting star can sometimes send the wrong signal, especially when trading in unpredictable markets. It doesn't show when to sell or buy. Thus, risk management is necessary to avoid losing money.
What is peculiar to the shooting star candle pattern from others?
The shooting star indicates a downward trend after a price increase. Patterns like the inverted hammer indicate an upward trend after a price decrease. Understanding these differences is important for effective trading strategies.
Could you provide real-life examples of the shooting star pattern in stock trading?
Famous stocks and their charts can show when shooting stars have predicted changes in the market. Tools like the Sahi Trading app can help us learn from these examples.
The Sahi Trading App Provides Instructions for Trading Shooting Stars
The Sahi Trading app makes trading very easy. It helps us identify and then react to patterns, such as the shooting star, making our trading experience better.
Disclaimer
The content provided is for educational purposes only and does not constitute financial advice. For full details, refer to the disclaimer document.
desktop.
Trade on the go with Sahi
Mobile App